- Analiza
- Novosti i instrumenti
- Vesti sa tržišta
- Gold Price Forecast: XAU/USD remains poised to challenge $1,833 ahead of US data – Confluence Detector
Gold Price Forecast: XAU/USD remains poised to challenge $1,833 ahead of US data – Confluence Detector
- Gold price is consolidating Friday’s rebound amid a mixed market sentiment on Monday.
- Hawkish Fed outlook, China’s covid woes fail to impress US Dollar bulls.
- US Treasury yields rally, capping the Gold price upside. Will it reclaim $1,800?
Gold price is consolidating Tuesday’s massive gains well above $1,810, as bulls take a breather before resuming the uptrend. The US Dollar attempts a tepid bounce after the previous sell-off induced by the Bank of Japan’s (BoJ) surprise move, which rattled markets and smashed the greenback alongside the USD/JPY pair. The BoJ unexpectedly widened the band its target range for 10-year Japanese government bond yields, sparking a huge selling wave in bonds and stocks around the world. The market chaos and the resultant risk-off flows also helped Gold price see sizeable gains while the ongoing surge in the US Treasury bond yields poses a threat to the further upside in the bright metal. With the final policy decision from a major central bank, the BoJ, out of the way, investors prepare for thin market conditions heading toward the Christmas weekend. Although Friday’s US Durable Goods and PCE inflation data will offer some trading incentives.
Also read: Where are precious metals prices and premiums headed?
Gold Price: Key levels to watch
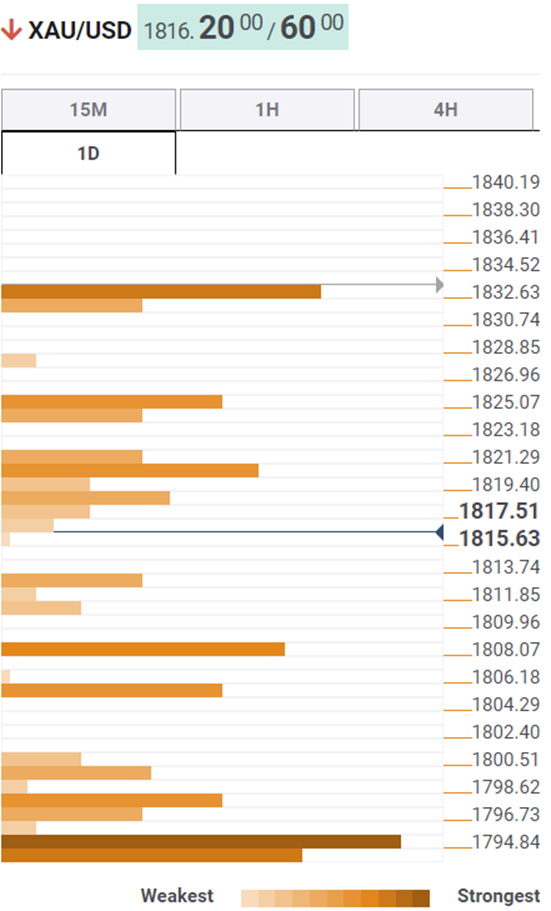
The Technical Confluence Detector shows that the gold price is running into a minor resistance at $1,819, the SMA10 one-hour, above which bulls will have a hard time overcoming the convergence of the previous day’s high and the pivot point one-week S1 at $1,821.
Acceptance above the latter is critical to initiating a fresh upswing to $1,833, where the pivot point one-month R1 and pivot point one-day R1 meet.
Alternatively, the Fibonacci 23.6% one-day at $1,812 will come to Gold buyers’ rescue should the retracement gather steam.
The next downside cap is envisioned at the Fibonacci 38.2% one-day at $1,808, below which the critical Fibonacci 61.8% one-week at $1,806 will be challenged.
Further south, the Fibonacci 61.8% one-day at $1,800 will be seen as the last resort for Gold bulls.
Here is how it looks on the tool
About Technical Confluences Detector
The TCD (Technical Confluences Detector) is a tool to locate and point out those price levels where there is a congestion of indicators, moving averages, Fibonacci levels, Pivot Points, etc. If you are a short-term trader, you will find entry points for counter-trend strategies and hunt a few points at a time. If you are a medium-to-long-term trader, this tool will allow you to know in advance the price levels where a medium-to-long-term trend may stop and rest, where to unwind positions, or where to increase your position size.


© 2000-2026. Sva prava zaštićena.
Sajt je vlasništvo kompanije Teletrade D.J. LLC 2351 LLC 2022 (Euro House, Richmond Hill Road, Kingstown, VC0100, St. Vincent and the Grenadines).
Svi podaci koji se nalaze na sajtu ne predstavljaju osnovu za donošenje investicionih odluka, već su informativnog karaktera.
The company does not serve or provide services to customers who are residents of the US, Canada, Iran, The Democratic People's Republic of Korea, Yemen and FATF blacklisted countries.
Izvršenje trgovinskih operacija sa finansijskim instrumentima upotrebom marginalne trgovine pruža velike mogućnosti i omogućava investitorima ostvarivanje visokih prihoda. Međutim, takav vid trgovine povezan je sa potencijalno visokim nivoom rizika od gubitka sredstava. Проведение торговых операций на финанcовых рынках c маржинальными финанcовыми инcтрументами открывает широкие возможноcти, и позволяет инвеcторам, готовым пойти на риcк, получать выcокую прибыль, но при этом неcет в cебе потенциально выcокий уровень риcка получения убытков. Iz tog razloga je pre započinjanja trgovine potrebno odlučiti o izboru odgovarajuće investicione strategije, uzimajući u obzir raspoložive resurse.
Upotreba informacija: U slučaju potpunog ili delimičnog preuzimanja i daljeg korišćenja materijala koji se nalazi na sajtu, potrebno je navesti link odgovarajuće stranice na sajtu kompanije TeleTrade-a kao izvora informacija. Upotreba materijala na internetu mora biti praćena hiper linkom do web stranice teletrade.org. Automatski uvoz materijala i informacija sa stranice je zabranjen.
Ako imate bilo kakvih pitanja, obratite nam se pr@teletrade.global.
транcфери