- Analiza
- Novosti i instrumenti
- Vesti sa tržišta
- Gold Price Forecast: XAU/USD bulls need validation from $1,835 – Confluence Detector
Gold Price Forecast: XAU/USD bulls need validation from $1,835 – Confluence Detector
- Gold price struggle for clear directions amid holiday mood.
- US Dollar Index rebounds amid risk-negative headlines surrounding China, pre-data caution.
- Fed Minutes, US NFP will be crucial as XAU/USD struggles around key resistance.
Gold price (XAU/USD) remains sidelined as holidays in major markets restrict the precious metal’s moves during early Monday. Also acting as an upside filter is the US Dollar’s rebound amid escalating fears from China, as well as headlines suggesting the US growth optimism, backed by comments from the International Monetary Fund’s (IMF) Managing Director Kristalina Georgieva. Even so, the recently softer US data, mainly surrounding inflation and activities, join an absence of the hawkish Fedspeak to keep Gold buyers hopeful.
That said, Gold traders may witness inaction during the rest of the day but the current week holds multiple key catalysts and hence become warrants caution. Among them, this week’s activity data from the US, Minutes of the latest Federal Open Market Committee (FOMC) meeting and December month employment numbers are crucial for clear directions.
Also read: Gold Price Annual Forecast: Will 2023 be the year Gold shines?
Gold Price: Key levels to watch
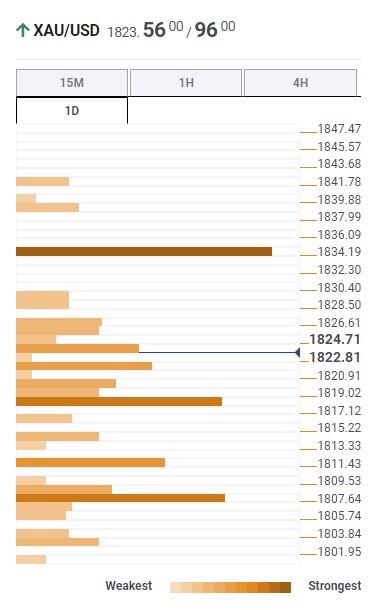
The Technical Confluence Detector shows that the Gold price grinds higher towards the $1,835 key hurdle comprising the previous weekly and monthly high, as well as the Pivot Point one-day R2.
Following that, a run-up towards June 2022 peak surrounding $1,880 can’t be ruled out.
Alternatively, pullback moves remain elusive beyond the $1,819 level that includes Fibonacci 61.8% on one-day and SMA10 on 4H.
In a case where the Gold price drops below $1,819, a convergence of the 200-HMA and Pivot Point one-day S2, around $1,808, will be crucial to watch.
Should the Gold bears keep the reins past $1,808, the odds of witnessing a slump toward the $1,800 threshold can’t be ruled out.
Here is how it looks on the tool
About Technical Confluences Detector
The TCD (Technical Confluences Detector) is a tool to locate and point out those price levels where there is a congestion of indicators, moving averages, Fibonacci levels, Pivot Points, etc. If you are a short-term trader, you will find entry points for counter-trend strategies and hunt a few points at a time. If you are a medium-to-long-term trader, this tool will allow you to know in advance the price levels where a medium-to-long-term trend may stop and rest, where to unwind positions, or where to increase your position


© 2000-2026. Sva prava zaštićena.
Sajt je vlasništvo kompanije Teletrade D.J. LLC 2351 LLC 2022 (Euro House, Richmond Hill Road, Kingstown, VC0100, St. Vincent and the Grenadines).
Svi podaci koji se nalaze na sajtu ne predstavljaju osnovu za donošenje investicionih odluka, već su informativnog karaktera.
The company does not serve or provide services to customers who are residents of the US, Canada, Iran, The Democratic People's Republic of Korea, Yemen and FATF blacklisted countries.
Izvršenje trgovinskih operacija sa finansijskim instrumentima upotrebom marginalne trgovine pruža velike mogućnosti i omogućava investitorima ostvarivanje visokih prihoda. Međutim, takav vid trgovine povezan je sa potencijalno visokim nivoom rizika od gubitka sredstava. Проведение торговых операций на финанcовых рынках c маржинальными финанcовыми инcтрументами открывает широкие возможноcти, и позволяет инвеcторам, готовым пойти на риcк, получать выcокую прибыль, но при этом неcет в cебе потенциально выcокий уровень риcка получения убытков. Iz tog razloga je pre započinjanja trgovine potrebno odlučiti o izboru odgovarajuće investicione strategije, uzimajući u obzir raspoložive resurse.
Upotreba informacija: U slučaju potpunog ili delimičnog preuzimanja i daljeg korišćenja materijala koji se nalazi na sajtu, potrebno je navesti link odgovarajuće stranice na sajtu kompanije TeleTrade-a kao izvora informacija. Upotreba materijala na internetu mora biti praćena hiper linkom do web stranice teletrade.org. Automatski uvoz materijala i informacija sa stranice je zabranjen.
Ako imate bilo kakvih pitanja, obratite nam se pr@teletrade.global.
транcфери