- Analiza
- Novosti i instrumenti
- Vesti sa tržišta
- Gold Price Forecast: XAU/USD eyes $1,918 and $1,922 on the road to recovery – Confluence Detector
Gold Price Forecast: XAU/USD eyes $1,918 and $1,922 on the road to recovery – Confluence Detector
- Gold price stages a decent comeback as US Dollar falls with Treasury bond yields.
- USD/JPY reversal post-BoJ also weighs down on the US Dollar ahead of US data.
- Gold price needs to take out the key $1,918 barrier to resume the uptrend.
Gold price has stalled its ongoing corrective downside, staging a decent comeback so far this Wednesday. The US Dollar has reversed its early gains amid falling US Treasury bond yields, which has helped Gold price recover lost ground. Meanwhile, Gold price continues to benefit from increased bets of smaller US Federal Reserve (Fed) rate hikes, although the US Retail Sales and Producer Price Index (PPI) will help shed more light on the same. Earlier in the day. the Bank of Japan (BoJ) stood pat on its yield control policy, which drove USD/JPY through the roof, propelling the US Dollar in tandem. Although the moves are seen reversing, as investors gear up for the high-impact US economic data.
Also read: Gold Price Forecast: XAU/USD eyes further correction toward $1,870 amid bearish technicals
Gold Price: Key levels to watch
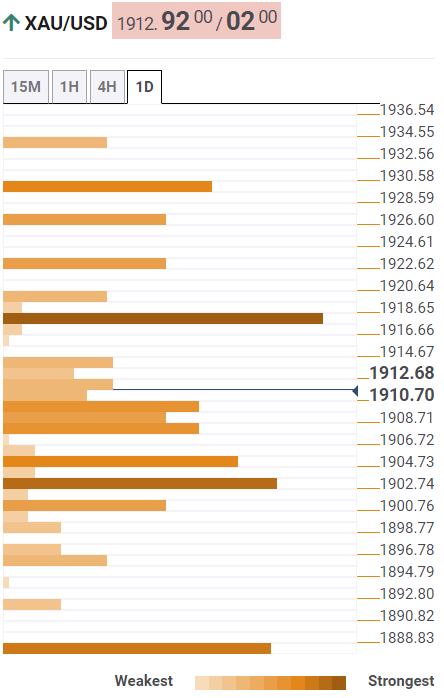
The Technical Confluence Detector shows that the gold price is facing immediate resistance at $1,914, which is the Fibonacci 61.8% one-day.
A break above which will put the powerful hurdle at $1,918 under threat. That level is the convergence of the pivot point one-month R3 and pivot point one-day R1.
Acceptance above the latter is critical to extending the renewed upside toward the previous week’s high at $1,922. Further up, the nine-month top at $1,929 will challenge bearish commitments.
On the flip side, a dense cluster of healthy support levels awaits around $1,909, which is the meeting point of the Fibonacci 23.6% one-week, Fibonacci 38.2% one-day and SMA5 four-hour.
Should bears flex their muscles, then the previous day’s low at $1,903 could be put to test. The last line of defense for Gold buyers is seen at the Fibonacci 38.2% one-week at $1,899.
Here is how it looks on the tool
About Technical Confluences Detector
The TCD (Technical Confluences Detector) is a tool to locate and point out those price levels where there is a congestion of indicators, moving averages, Fibonacci levels, Pivot Points, etc. If you are a short-term trader, you will find entry points for counter-trend strategies and hunt a few points at a time. If you are a medium-to-long-term trader, this tool will allow you to know in advance the price levels where a medium-to-long-term trend may stop and rest, where to unwind positions, or where to increase your position size.


© 2000-2026. Sva prava zaštićena.
Sajt je vlasništvo kompanije Teletrade D.J. LLC 2351 LLC 2022 (Euro House, Richmond Hill Road, Kingstown, VC0100, St. Vincent and the Grenadines).
Svi podaci koji se nalaze na sajtu ne predstavljaju osnovu za donošenje investicionih odluka, već su informativnog karaktera.
The company does not serve or provide services to customers who are residents of the US, Canada, Iran, The Democratic People's Republic of Korea, Yemen and FATF blacklisted countries.
Izvršenje trgovinskih operacija sa finansijskim instrumentima upotrebom marginalne trgovine pruža velike mogućnosti i omogućava investitorima ostvarivanje visokih prihoda. Međutim, takav vid trgovine povezan je sa potencijalno visokim nivoom rizika od gubitka sredstava. Проведение торговых операций на финанcовых рынках c маржинальными финанcовыми инcтрументами открывает широкие возможноcти, и позволяет инвеcторам, готовым пойти на риcк, получать выcокую прибыль, но при этом неcет в cебе потенциально выcокий уровень риcка получения убытков. Iz tog razloga je pre započinjanja trgovine potrebno odlučiti o izboru odgovarajuće investicione strategije, uzimajući u obzir raspoložive resurse.
Upotreba informacija: U slučaju potpunog ili delimičnog preuzimanja i daljeg korišćenja materijala koji se nalazi na sajtu, potrebno je navesti link odgovarajuće stranice na sajtu kompanije TeleTrade-a kao izvora informacija. Upotreba materijala na internetu mora biti praćena hiper linkom do web stranice teletrade.org. Automatski uvoz materijala i informacija sa stranice je zabranjen.
Ako imate bilo kakvih pitanja, obratite nam se pr@teletrade.global.
транcфери