- Analiza
- Novosti i instrumenti
- Vesti sa tržišta
- AUD/USD Price Analysis: Australian Dollar faces heat as market mood sours
AUD/USD Price Analysis: Australian Dollar faces heat as market mood sours
-
Investors have turned risk-averse ahead of the US PCE Price Index data.
-
The formation of an Ascending Triangle indicates sheer volatility contraction.
-
The RSI (14) has shifted into the 40.00-60.. range, which indicates an exhaustion in the upside momentum.
The AUD/USD pair has corrected sharply to near 0.7100 in the early European session. The Aussie asset has sensed selling pressure as investors have turned risk averse ahead of the release of the United States Personal Consumption Expenditure (PCE) Price Index data. Meanwhile, an improvement in the safe-haven’s appeal has strengthened the US Dollar Index (DXY).
S&P500 futures has demonstrated a sell-off as further interest rate hikes by the Federal Reserve (Fed) might accelerate recession fears. The 10-year US Treasury yields has added gains further to near 3.53%.
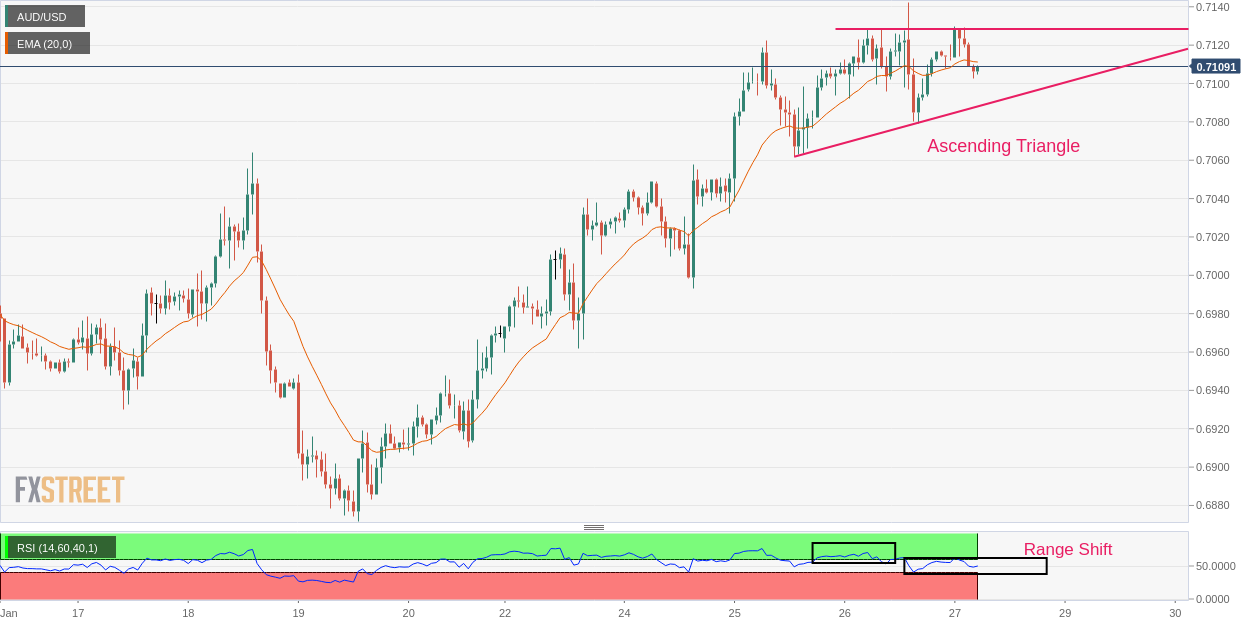
On an hourly scale, AUD/USD is oscillating in an Ascending Triangle chart pattern that indicates a sheer contraction in volatility. The upward-sloping trendline of the chart pattern is plotted from January 25 average price at 0.7061 while the horizontal resistance is placed from January 26 high around 0.7140.
The 20-period Exponential Moving Average (EMA) at 0.7110 has overlapped the asset, which indicates a rangebound acution profile.
It is observed that the Relative Strength Index (RSI) (14) has shifted into the 40.00-60.00 range from the bullish range of 60.00-80.00, which conveys that the bullish momentum has faded now.
Should the asset breaks above January 26 high at 0.7142, Aussie asset will deliver a breakout the Ascending Triangle, which will drive the major towards the round-level resistance of 0.7200. A breach of the latter will expose the asset for more upside toward June 3 high at 0.7283.
On the contrary, a downside move below December 29 low at 0.6710 will drag the major further toward December 22 low at 0.6650 followed by November 21 low at 0.6585.
AUD/USD hourly chart


© 2000-2026. Sva prava zaštićena.
Sajt je vlasništvo kompanije Teletrade D.J. LLC 2351 LLC 2022 (Euro House, Richmond Hill Road, Kingstown, VC0100, St. Vincent and the Grenadines).
Svi podaci koji se nalaze na sajtu ne predstavljaju osnovu za donošenje investicionih odluka, već su informativnog karaktera.
The company does not serve or provide services to customers who are residents of the US, Canada, Iran, The Democratic People's Republic of Korea, Yemen and FATF blacklisted countries.
Izvršenje trgovinskih operacija sa finansijskim instrumentima upotrebom marginalne trgovine pruža velike mogućnosti i omogućava investitorima ostvarivanje visokih prihoda. Međutim, takav vid trgovine povezan je sa potencijalno visokim nivoom rizika od gubitka sredstava. Проведение торговых операций на финанcовых рынках c маржинальными финанcовыми инcтрументами открывает широкие возможноcти, и позволяет инвеcторам, готовым пойти на риcк, получать выcокую прибыль, но при этом неcет в cебе потенциально выcокий уровень риcка получения убытков. Iz tog razloga je pre započinjanja trgovine potrebno odlučiti o izboru odgovarajuće investicione strategije, uzimajući u obzir raspoložive resurse.
Upotreba informacija: U slučaju potpunog ili delimičnog preuzimanja i daljeg korišćenja materijala koji se nalazi na sajtu, potrebno je navesti link odgovarajuće stranice na sajtu kompanije TeleTrade-a kao izvora informacija. Upotreba materijala na internetu mora biti praćena hiper linkom do web stranice teletrade.org. Automatski uvoz materijala i informacija sa stranice je zabranjen.
Ako imate bilo kakvih pitanja, obratite nam se pr@teletrade.global.
транcфери