- Analiza
- Novosti i instrumenti
- Vesti sa tržišta
- Gold Price Forecast: XAU/USD stays bearish below $1,873, US inflation clues eyed – Confluence Detector
Gold Price Forecast: XAU/USD stays bearish below $1,873, US inflation clues eyed – Confluence Detector
- Gold price remains sidelined within short-term key trading range amid contradicting fundamentals, cautious mood.
- Fed policymakers seem less interested in backing aggressive rate hikes amid mixed employment data.
- Recession woes underpin US Dollar demand and weigh on XAU/USD ahead of the key US consumer-centric statistics.
Gold price (XAU/USD) treads water around the mid-$1,800s, despite bracing for the second weekly loss, as market players struggle for clear directions amid contrasting fundamentals and anxiety ahead of the key United States data. That said, Thursday’s softer US Jobless Claims allowed Richmond Fed President Thomas Barkin to follow Fed Chair Jerome Powell and mark hesitance in raising the rates further. The same joined China-linked optimism to weigh on the US Dollar and allow the XAU/USD to float higher. Alternatively, the widest yield curve inversion since 1980 renews recession fears and puts a floor under the Gold price.
Moving on, early signals for US inflation will be eyed closely after China’s Consumer Price Index (CPI) and Producer Price Index (PPI) eased in January. Following that, the next week’s US CPI will be crucial to watch for clear directions as Gold traders appear to lack conviction.
Also read: Gold Price Forecast: XAU/USD defies bullish bias on United States Treasury yield curve inversion, US data eyed
Gold Price: Key levels to watch
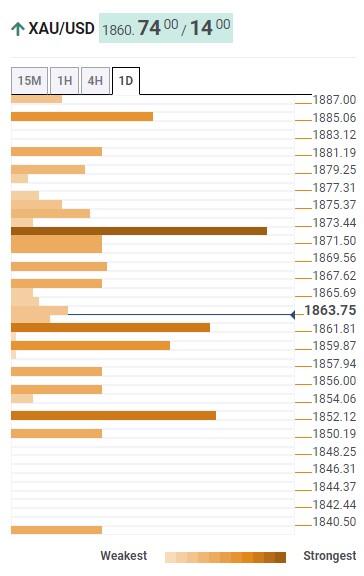
The Technical Confluence Detector shows that the Gold price grinds lower after breaking the $1,873 support, comprising Fibonacci 61.8% on one-day and the middle band of the Bollinger on the hourly play.
Even so, a convergence of the previous weekly low, bottom line of the Bollinger on four-hour (4H) and 5-HMA restrict immediate downside of the yellow metal around $1,860.
Following that, a quick decline towards the $1,853 support confluence, encompassing Pivot Point one-month S1, can’t be ruled out.
Alternatively, a successful break of the $1,873 hurdle will need validation from the $1,887 resistance level, including the Fibonacci 23.6% on weekly, to convince Gold buyers.
In that case, the $1,900 round figure will gain the major attention of the XAU/USD bulls.
Here is how it looks on the tool
About Technical Confluences Detector
The TCD (Technical Confluences Detector) is a tool to locate and point out those price levels where there is a congestion of indicators, moving averages, Fibonacci levels, Pivot Points, etc. If you are a short-term trader, you will find entry points for counter-trend strategies and hunt a few points at a time. If you are a medium-to-long-term trader, this tool will allow you to know in advance the price levels where a medium-to-long-term trend may stop and rest, where to unwind positions, or where to increase your position size.


© 2000-2026. Sva prava zaštićena.
Sajt je vlasništvo kompanije Teletrade D.J. LLC 2351 LLC 2022 (Euro House, Richmond Hill Road, Kingstown, VC0100, St. Vincent and the Grenadines).
Svi podaci koji se nalaze na sajtu ne predstavljaju osnovu za donošenje investicionih odluka, već su informativnog karaktera.
The company does not serve or provide services to customers who are residents of the US, Canada, Iran, The Democratic People's Republic of Korea, Yemen and FATF blacklisted countries.
Izvršenje trgovinskih operacija sa finansijskim instrumentima upotrebom marginalne trgovine pruža velike mogućnosti i omogućava investitorima ostvarivanje visokih prihoda. Međutim, takav vid trgovine povezan je sa potencijalno visokim nivoom rizika od gubitka sredstava. Проведение торговых операций на финанcовых рынках c маржинальными финанcовыми инcтрументами открывает широкие возможноcти, и позволяет инвеcторам, готовым пойти на риcк, получать выcокую прибыль, но при этом неcет в cебе потенциально выcокий уровень риcка получения убытков. Iz tog razloga je pre započinjanja trgovine potrebno odlučiti o izboru odgovarajuće investicione strategije, uzimajući u obzir raspoložive resurse.
Upotreba informacija: U slučaju potpunog ili delimičnog preuzimanja i daljeg korišćenja materijala koji se nalazi na sajtu, potrebno je navesti link odgovarajuće stranice na sajtu kompanije TeleTrade-a kao izvora informacija. Upotreba materijala na internetu mora biti praćena hiper linkom do web stranice teletrade.org. Automatski uvoz materijala i informacija sa stranice je zabranjen.
Ako imate bilo kakvih pitanja, obratite nam se pr@teletrade.global.
транcфери