- Analiza
- Novosti i instrumenti
- Vesti sa tržišta
- Gold Price Forecast: XAU/USD bears keep the reins below $1,845 – Confluence Detector
Gold Price Forecast: XAU/USD bears keep the reins below $1,845 – Confluence Detector
- Gold bears flirt with intraday low during two-day losing streak, fades Friday’s bounce off seven-week low.
- Sour sentiment, full markets underpin US Dollar rebound and weigh on XAU/USD amid firmer yields.
- Global PMIs, Fed Minutes eyed for clear directions amid bearish bias.
Gold price (XAU/USD) retreats towards the previous weekly low, also the lowest since late December, as risk aversion joins the return of full markets to underpin the US Dollar. Adding strength to the greenback, as well as weighing on the XAU/USD, could be the upbeat US Treasury bond yields.
That said, geopolitical fears surrounding China and Russia seem to propel the latest rush toward risk safety. On the same line are fresh concerns over the Federal Reserve's (Fed) hawkish move, following the strong US data. It’s worth noting, however, that the cautious mood ahead of the preliminary readings of the US Purchasing Managers Index (PMI) data for February seems to challenge the Gold price. Also important is Wednesday’s Federal Open Market Committee’s (FOMC) Monetary Policy Meeting Minutes.
In addition to the cautious mood and fears of higher Fed rate, technical confluence also keeps Gold bears hopeful.
Also read: Gold Price Forecast: XAU/USD sellers lurk at $1,850, downside remains favored
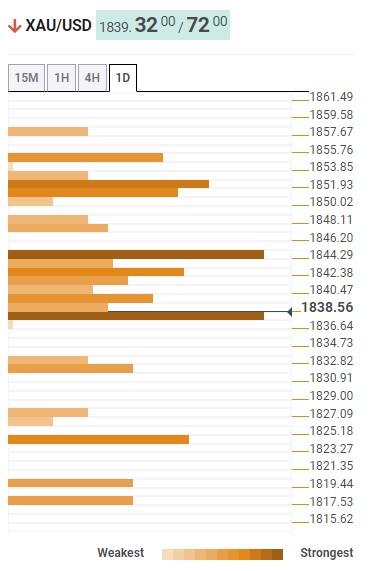
Gold Price: Key levels to watch
The Technical Confluence Detector shows that the Gold price attacks the short-term key support near $1,837, comprising Pivot Point one day S1, 50-HMA and previous lows on the four-hour, one-hour and one-day.
That said, the metal’s latest weakness could be linked to the pullback from another key technical level, namely $1,845 that comprises Fibonacci 61.8% one-day, previous high on four-hour and the upper Bollinger on 15-minutes.
Also acting as a short-term important resistance is the 200-HMA, Pivot Point one-day R2 and Pivot Point one-month S1, close to $1,852.
Meanwhile, the Gold price weakness below the immediate $1,837 support has an open space towards the south unless hitting the previous monthly low surrounding $1,825.
Following that, the previous weekly low and Pivot Point one week S1 could entertain the XAU/USD bears around $1,819-17 before highlighting the $1,800 threshold.
Here is how it looks on the tool
About Technical Confluences Detector
The TCD (Technical Confluences Detector) is a tool to locate and point out those price levels where there is a congestion of indicators, moving averages, Fibonacci levels, Pivot Points, etc. If you are a short-term trader, you will find entry points for counter-trend strategies and hunt a few points at a time. If you are a medium-to-long-term trader, this tool will allow you to know in advance the price levels where a medium-to-long-term trend may stop and rest, where to unwind positions, or where to increase your position size.


© 2000-2026. Sva prava zaštićena.
Sajt je vlasništvo kompanije Teletrade D.J. LLC 2351 LLC 2022 (Euro House, Richmond Hill Road, Kingstown, VC0100, St. Vincent and the Grenadines).
Svi podaci koji se nalaze na sajtu ne predstavljaju osnovu za donošenje investicionih odluka, već su informativnog karaktera.
The company does not serve or provide services to customers who are residents of the US, Canada, Iran, The Democratic People's Republic of Korea, Yemen and FATF blacklisted countries.
Izvršenje trgovinskih operacija sa finansijskim instrumentima upotrebom marginalne trgovine pruža velike mogućnosti i omogućava investitorima ostvarivanje visokih prihoda. Međutim, takav vid trgovine povezan je sa potencijalno visokim nivoom rizika od gubitka sredstava. Проведение торговых операций на финанcовых рынках c маржинальными финанcовыми инcтрументами открывает широкие возможноcти, и позволяет инвеcторам, готовым пойти на риcк, получать выcокую прибыль, но при этом неcет в cебе потенциально выcокий уровень риcка получения убытков. Iz tog razloga je pre započinjanja trgovine potrebno odlučiti o izboru odgovarajuće investicione strategije, uzimajući u obzir raspoložive resurse.
Upotreba informacija: U slučaju potpunog ili delimičnog preuzimanja i daljeg korišćenja materijala koji se nalazi na sajtu, potrebno je navesti link odgovarajuće stranice na sajtu kompanije TeleTrade-a kao izvora informacija. Upotreba materijala na internetu mora biti praćena hiper linkom do web stranice teletrade.org. Automatski uvoz materijala i informacija sa stranice je zabranjen.
Ako imate bilo kakvih pitanja, obratite nam se pr@teletrade.global.
транcфери