- Analiza
- Novosti i instrumenti
- Vesti sa tržišta
- AUD/USD extends V-shape recovery to 0.6760 as upbeat Caixin PMI outweighs Aussie CPI
AUD/USD extends V-shape recovery to 0.6760 as upbeat Caixin PMI outweighs Aussie CPI
- AUD/USD is struggling to extend recovery above 0.6760, upside looks favored amid the risk-on impulse.
- Federal Reserve might turn more hawkish if US ISM Manufacturing PMI delivers a surprise jump.
- A sense of relief has been observed by the Reserve Bank of Australia as inflation has softened significantly.
- AUD/USD looks failing to turn bullish despite a responsive buying move amid an Inverted Flag formation.
AUD/USD has stretched its V-shape recovery move above to near the 0.6760 resistance in the early European session. The Aussie asset witnessed a sell-off in the Asian session after the release of the downbeat Australian Gross Domestic Product (GDP) and a sheer decline in the monthly Consumer Price Index (CPI). The downside bias in the Australian Dollar faded after the release of the upbeat Caixin Manufacturing PMI data, which infused fresh blood into the Aussie and resulted in a V-shape recovery.
S&P500 futures have turned positive after recovering significant losses posted in the Tokyo session, portraying a sheer recovery in the risk appetite theme. The US Dollar Index (DXY) has refreshed its day low below 104.47 as investors have ignored the uncertainty associated with hawkish Federal Reserve (Fed) bets. Also, the safe-haven assets are struggling to find a cushion as investors have underpinned the risk-on mood. Contrary to the positive market sentiment, the return offered on the 10-year US Treasury bonds looks still solid around 3.94%.
RBA senses relief as Australian Inflation softens and GDP trims
Investors dumped the Australian Dollar in the Asian session after the Australian Bureau of Statistics reported significantly lower monthly Consumer Price Index (CPI) figures than anticipation. The monthly Consumer Price Index (CPI) (Jan) dropped significantly to 7.4% from the expectations of 8.0% and the prior release of 8.4%. A mammoth decline in the inflation data is going to provide a big relief to Reserve Bank of Australia (RBA) policymakers.
The Reserve Bank of Australia has been making efforts in bringing down inflationary pressures by the continuation of policy tightening. Reserve Bank of Australia Governor Philip Lowe has already pushed its Official Cash Rate (OCR) to 3.35% in order to tame the stubborn inflation. And, more rates must be in pipeline to achieve price stability sooner.
Apart from the monthly CPI, Australian Gross Domestic Product (GDP) (Q4) has dropped to 0.5% from the consensus of 0.8% and Q3 figure of 0.6%. On an annualized basis, the GDP has remained in line with expectations at 2.7%. A decline in GDP numbers also showcases lower demand from households, which will trim inflation projections ahead as producers will be forced to scale down the prices of their offerings.
Upbeat Caixin Manufacturing PMI strengthens the Australian Dollar
It was widely anticipated that China’s manufacturing sector will outperform after the rollback of strict lockdown measures. Chinese administration and the People’s Bank of China (PBoC) are dedicated to spurring economic recovery by improving domestic demand. The IHS Markit reported the Caixin Manufacturing PMI data at 51.6, higher than the expectations of 50.2 and the former release of 49.2.
Apart from that, China’s National Bureau of Statistics (NBS) Manufacturing PMI (Feb) landed higher at 52.6 vs. the consensus of 50.5 and the prior release of 50.1. The Services Manufacturing PMI exploded to 56.3 against 54.4 released in January while the street was anticipating a downbeat figure at 49.7.
It is worth noting that Australia is the leading trading partner of China and a sharp recovery in the Chinese economy is also supportive of the Australian Dollar.
ISM Manufacturing PMI- the next trigger for the US Dollar
The street is awaiting the release of the United States Institute of Supply Management (ISM) Manufacturing PMI data. As per the consensus, the economic data is seen at 48.0 from the former release of 47.4. Apart from that, the New Orders Index that conveys forward demand is expected to rebound to 43.7 from the prior figure of 42.5.
It is worth noting that the Manufacturing PMI is in a contraction phase consecutively for the past three months. A figure below 50.0 is considered as a contraction in the extent of activities. Federal Reserve policymakers are expected to keenly watch the PMI figures as a surprise upside could strengthen the expectations of more hikes ahead.
AUD/USD technical outlook
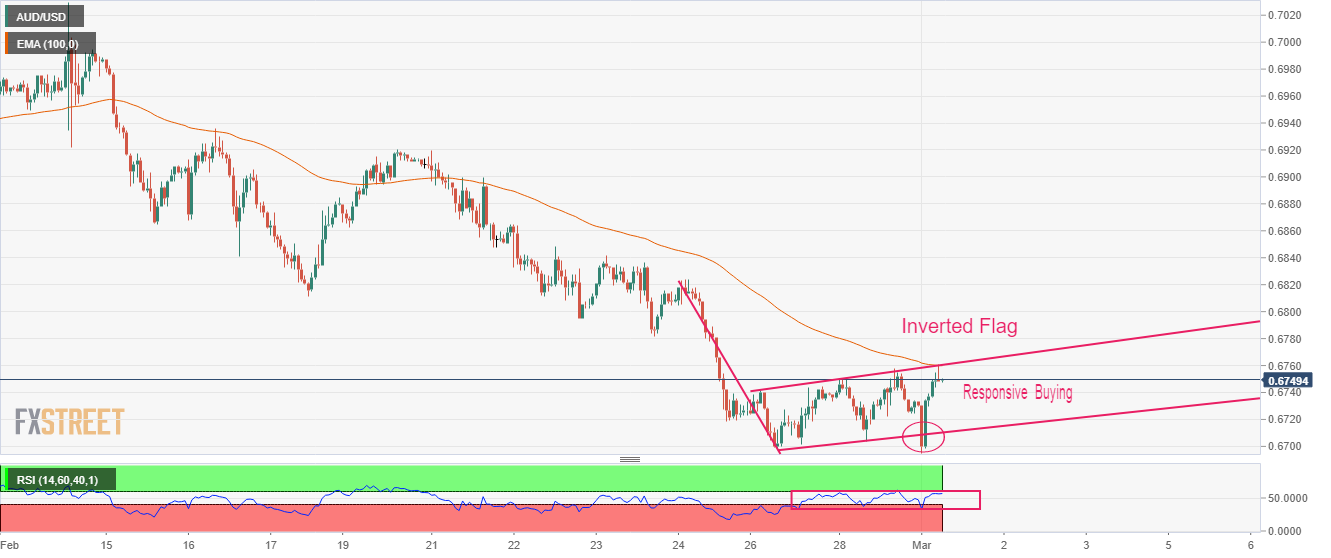
Despite a responsive buying action near the round-level support of 0.6700, the outlook for AUD/USD looks gloomy as the asset is forming an Inverted Flag chart pattern. The chart pattern indicates a sheer consolidation that is followed by a breakdown. Usually, the consolidation phase of the chart pattern serves as an inventory adjustment in which those participants initiate shorts, which prefer to enter an auction after the establishment of a bearish bias.
The 100-period Exponential Moving Average (EMA) around 0.6760 is acting as a barricade for the Aussie bulls.
Also, the Relative Strength Index (RSI) (14) is oscillating in the 40.00-60.00 range, indicating a consolidation ahead.


© 2000-2026. Sva prava zaštićena.
Sajt je vlasništvo kompanije Teletrade D.J. LLC 2351 LLC 2022 (Euro House, Richmond Hill Road, Kingstown, VC0100, St. Vincent and the Grenadines).
Svi podaci koji se nalaze na sajtu ne predstavljaju osnovu za donošenje investicionih odluka, već su informativnog karaktera.
The company does not serve or provide services to customers who are residents of the US, Canada, Iran, The Democratic People's Republic of Korea, Yemen and FATF blacklisted countries.
Izvršenje trgovinskih operacija sa finansijskim instrumentima upotrebom marginalne trgovine pruža velike mogućnosti i omogućava investitorima ostvarivanje visokih prihoda. Međutim, takav vid trgovine povezan je sa potencijalno visokim nivoom rizika od gubitka sredstava. Проведение торговых операций на финанcовых рынках c маржинальными финанcовыми инcтрументами открывает широкие возможноcти, и позволяет инвеcторам, готовым пойти на риcк, получать выcокую прибыль, но при этом неcет в cебе потенциально выcокий уровень риcка получения убытков. Iz tog razloga je pre započinjanja trgovine potrebno odlučiti o izboru odgovarajuće investicione strategije, uzimajući u obzir raspoložive resurse.
Upotreba informacija: U slučaju potpunog ili delimičnog preuzimanja i daljeg korišćenja materijala koji se nalazi na sajtu, potrebno je navesti link odgovarajuće stranice na sajtu kompanije TeleTrade-a kao izvora informacija. Upotreba materijala na internetu mora biti praćena hiper linkom do web stranice teletrade.org. Automatski uvoz materijala i informacija sa stranice je zabranjen.
Ako imate bilo kakvih pitanja, obratite nam se pr@teletrade.global.
транcфери