- Analiza
- Novosti i instrumenti
- Vesti sa tržišta
- WTI bulls waiting in the flanks at major support
WTI bulls waiting in the flanks at major support
- WTI bears are in control and eye a test of $72.00.
- However, the M-formation could see a correction in the forthcoming hours from major support.
Oil prices are weaker in mid-day trade on Wall Street after the United States reported inflation last month rose at an annualized 6% pace, matching expectations and down from 6.4% in January.
However, inflation is still way above the Federal Reserve's targets which imply prospects of a recession, especially amid the banking sector concerns that continue to challenge growth and demand-dependent commodities such as oil.
West Texas Intermediate crude oil is down by over 3% on the day now and printing fresh session lows in New York at the time of writing.
Looking to the charts, we can apply a multi-time frame analysis to determine prospects of a correction in the meanwhile but ultimately, a bearish bias prevails as follows:
WTI daily charts
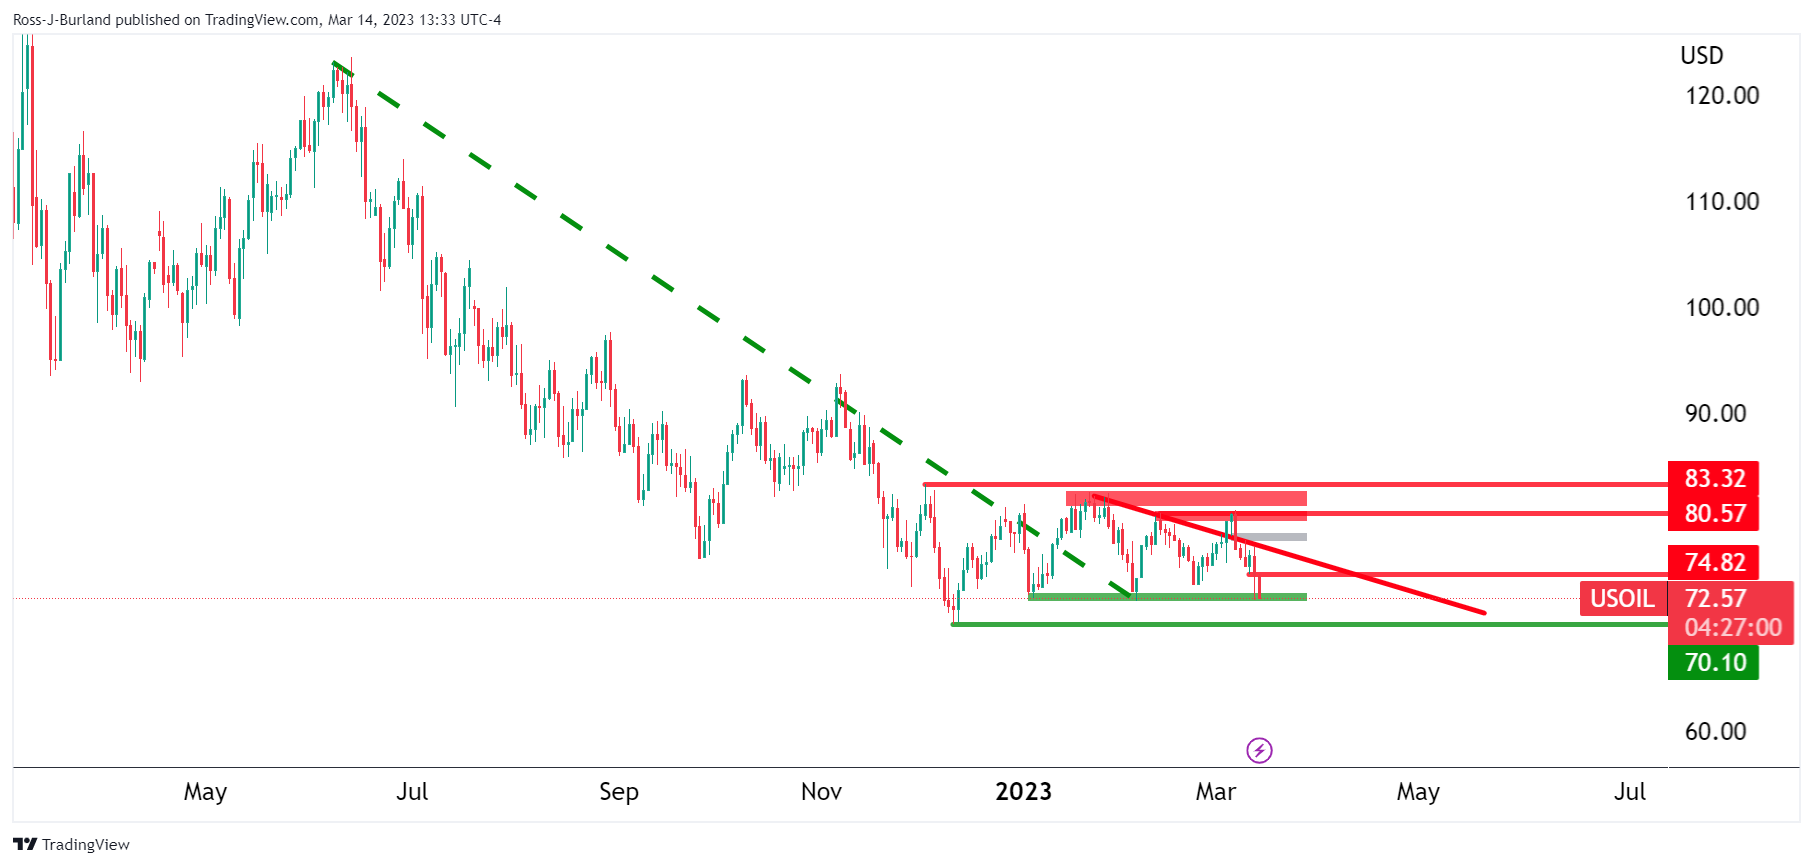
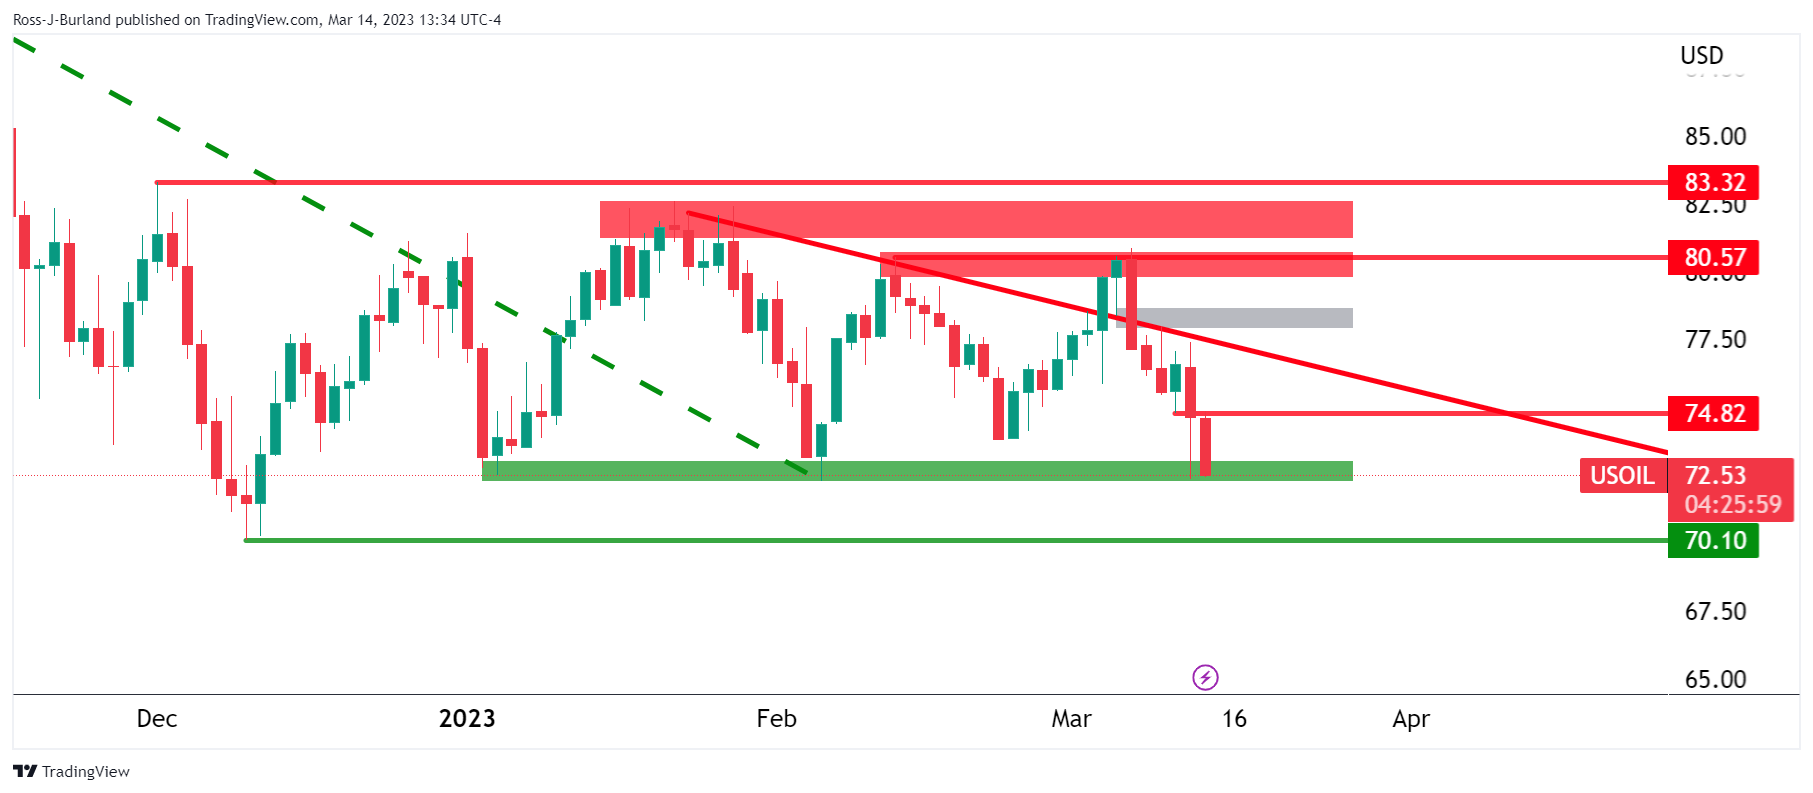
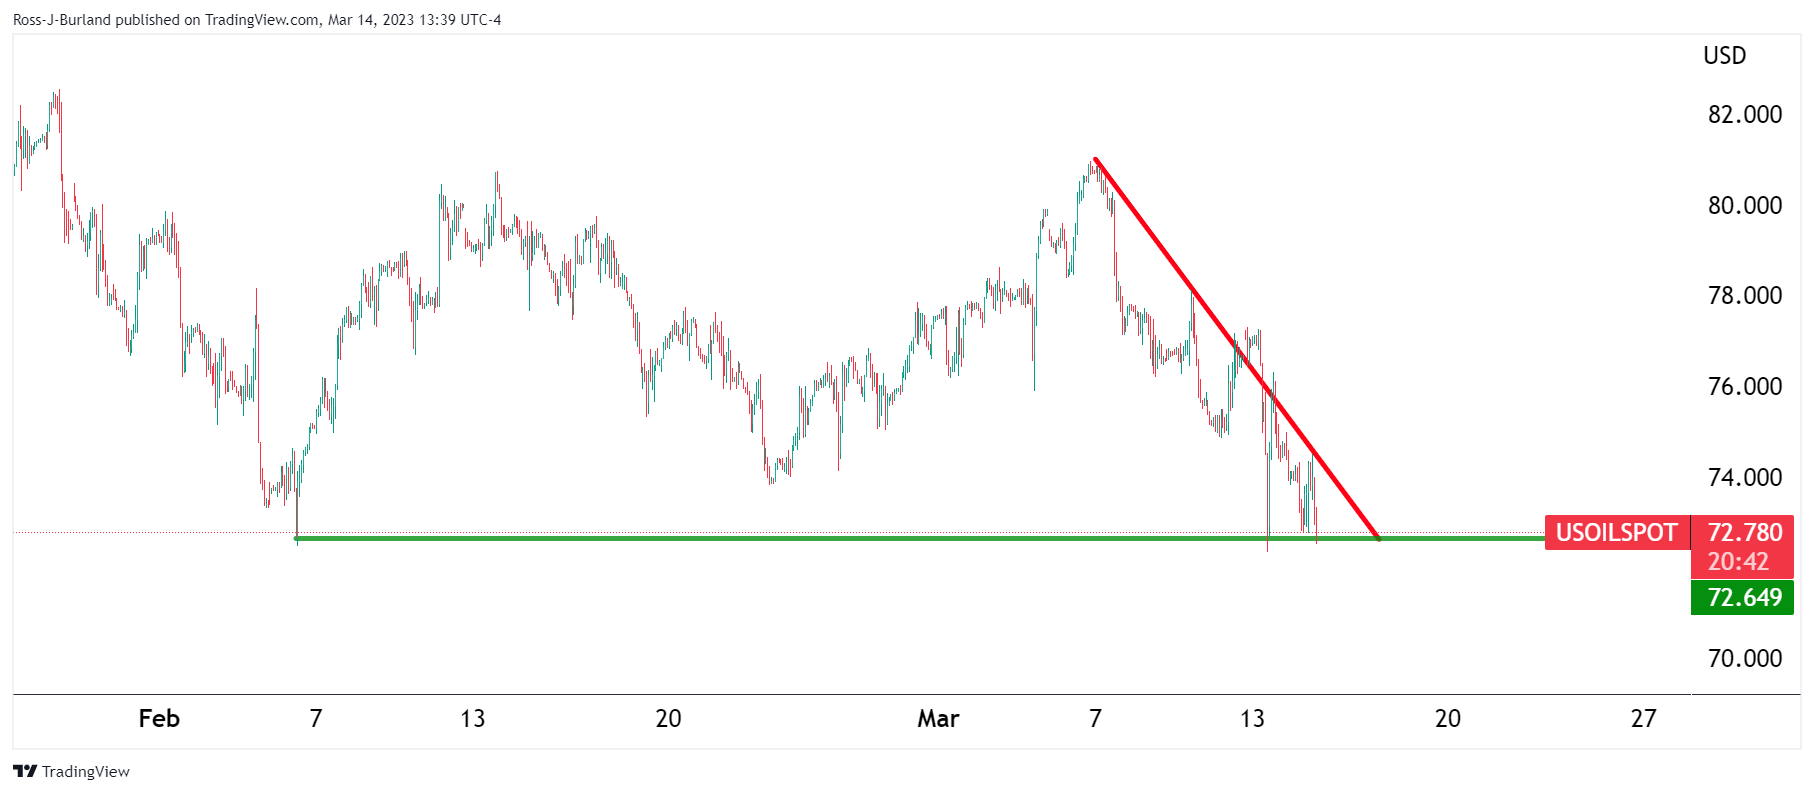
In a series of lower highs, the daily charts show the price moving sideways within a broad range of between $70.10 and $83.32. There is a price imbalance, greyed area, above $77.50, but the momentum is with the bears while below $74.80, and liquidity below $70.10 is calling. However, while being on the backside of the bearish trend, (broken bear trendline), this could be a phase of accumulation and a clear out of stale stops below $70.10 could result in a surge of demand further down the line. nonetheless, the bears are in control for the time being
WTI weekly charts
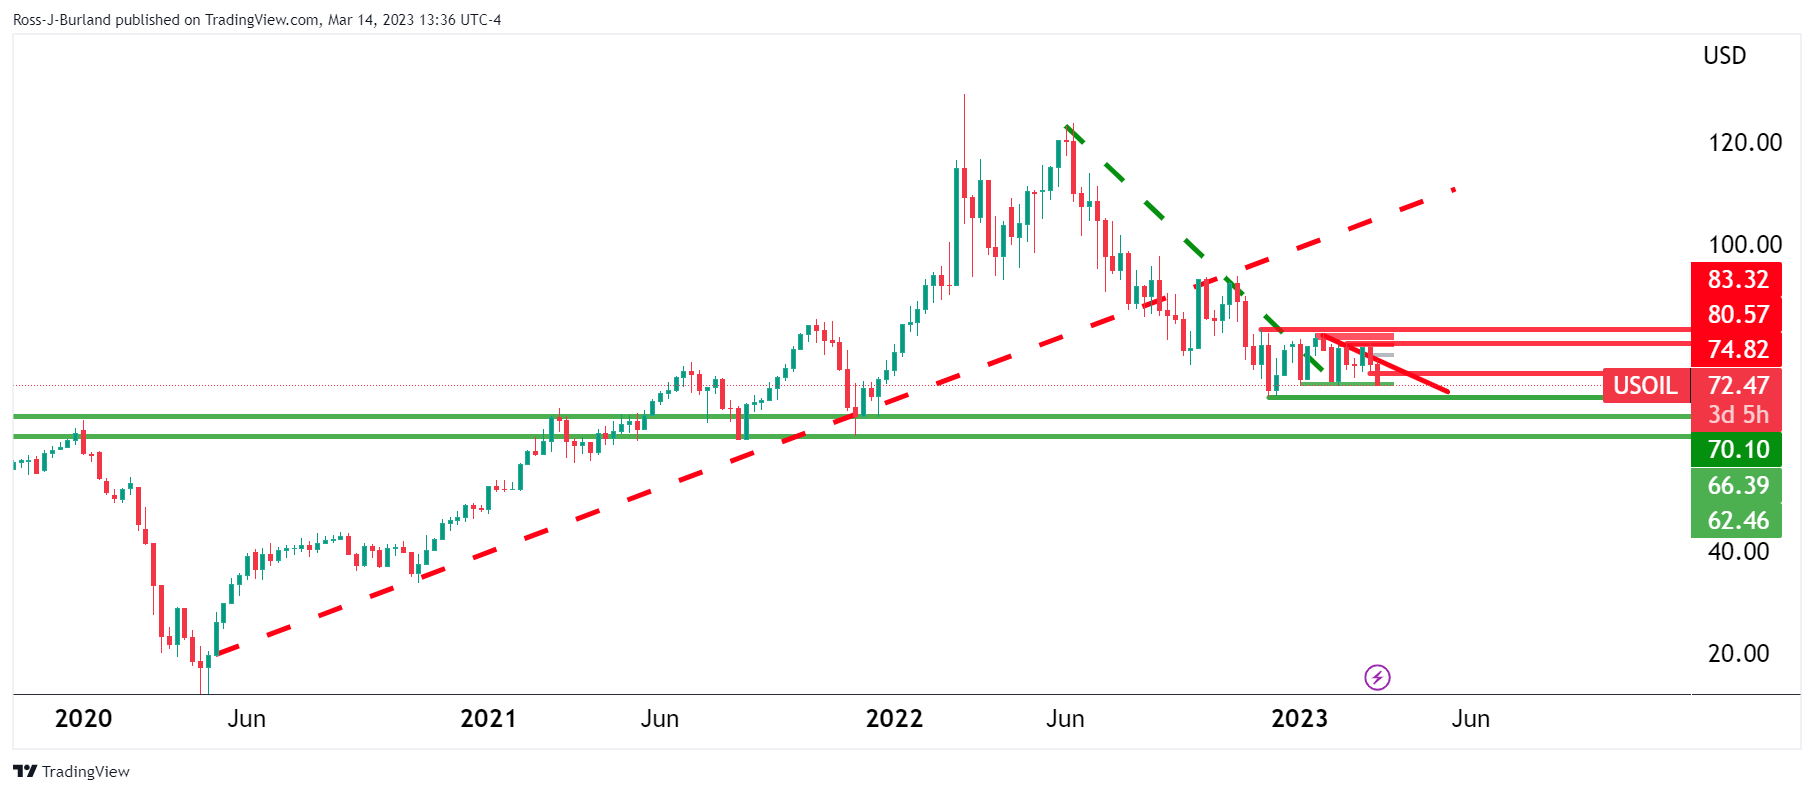
The weekly charts show that the price broke the bullish trend and is now backside and moving sideways but still biased lower while on the front side of the micro bear trendline below $74.82 as illustrated above.
However, the M-formation could hamstring the bears between $70.25 and the neckline near a 50% mean reversion of $76.70.
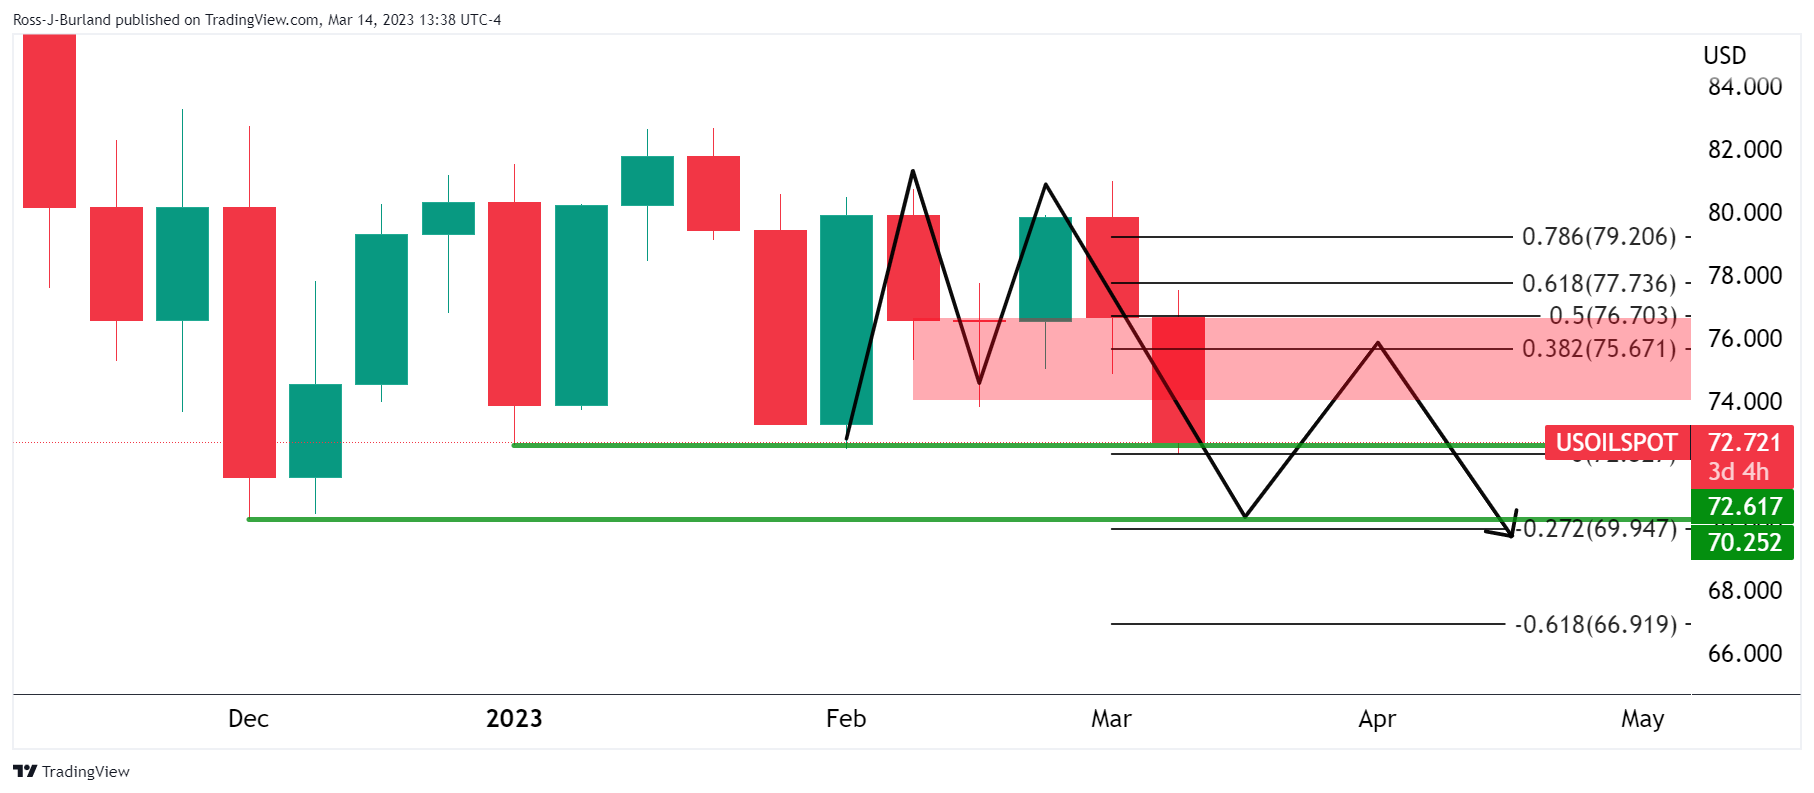
WTI H1 charts
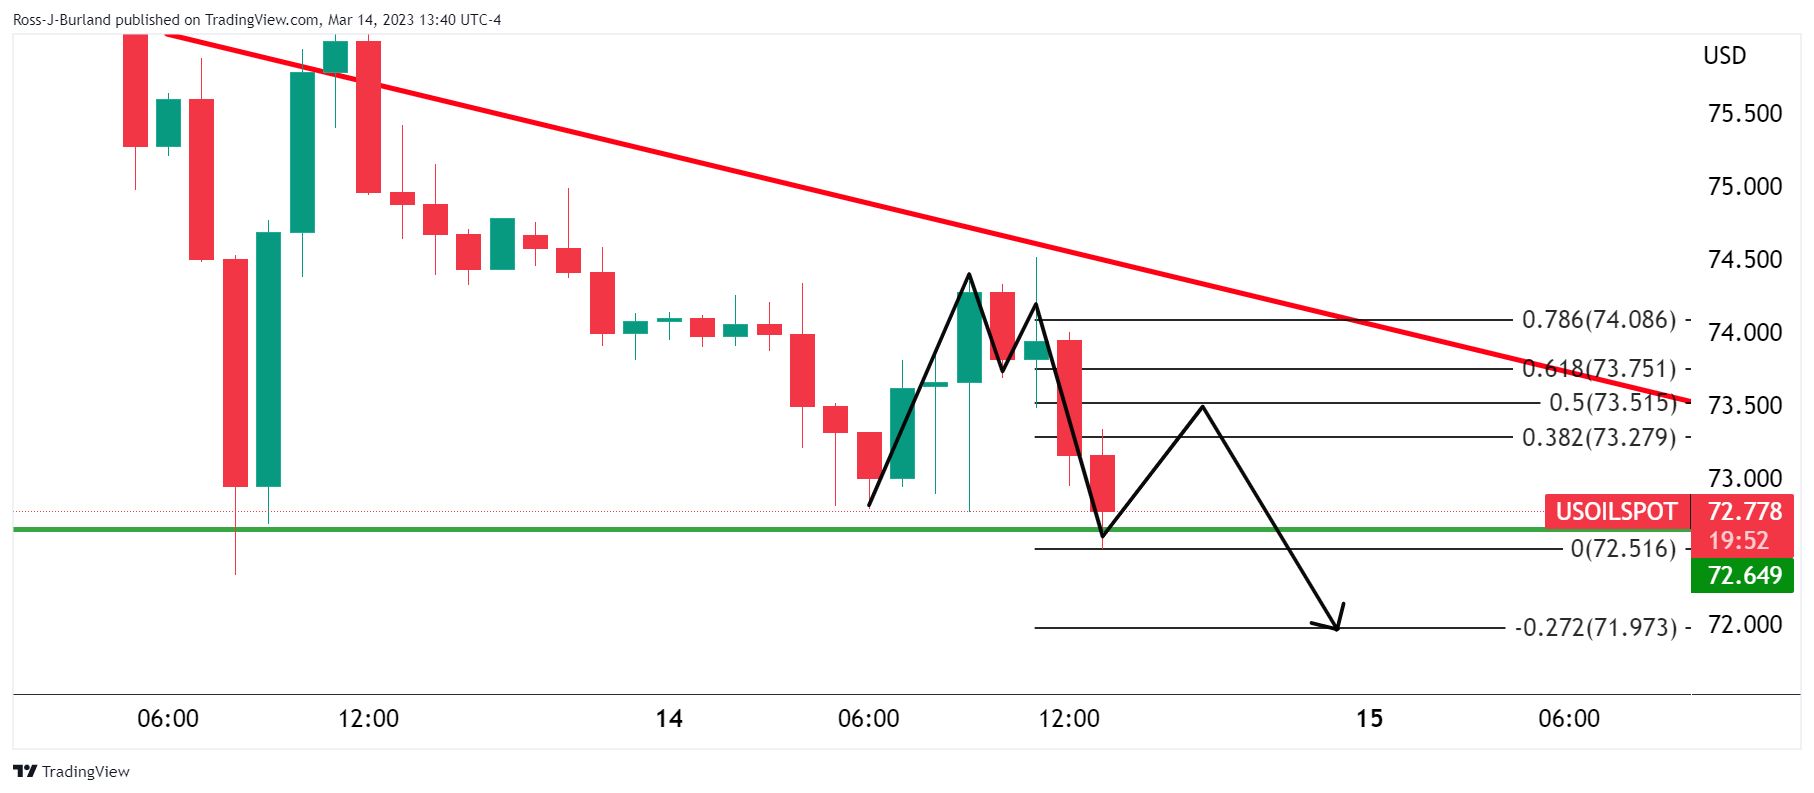
Moving down to the hourly chart, we see that the price is indeed on the front side of the bear trendline but meeting support. The M-formation, zooming in, is a reversion pattern that could see a correction in the forthcoming hours from support before a downside continuation to test $72 the figure.


© 2000-2026. Sva prava zaštićena.
Sajt je vlasništvo kompanije Teletrade D.J. LLC 2351 LLC 2022 (Euro House, Richmond Hill Road, Kingstown, VC0100, St. Vincent and the Grenadines).
Svi podaci koji se nalaze na sajtu ne predstavljaju osnovu za donošenje investicionih odluka, već su informativnog karaktera.
The company does not serve or provide services to customers who are residents of the US, Canada, Iran, The Democratic People's Republic of Korea, Yemen and FATF blacklisted countries.
Izvršenje trgovinskih operacija sa finansijskim instrumentima upotrebom marginalne trgovine pruža velike mogućnosti i omogućava investitorima ostvarivanje visokih prihoda. Međutim, takav vid trgovine povezan je sa potencijalno visokim nivoom rizika od gubitka sredstava. Проведение торговых операций на финанcовых рынках c маржинальными финанcовыми инcтрументами открывает широкие возможноcти, и позволяет инвеcторам, готовым пойти на риcк, получать выcокую прибыль, но при этом неcет в cебе потенциально выcокий уровень риcка получения убытков. Iz tog razloga je pre započinjanja trgovine potrebno odlučiti o izboru odgovarajuće investicione strategije, uzimajući u obzir raspoložive resurse.
Upotreba informacija: U slučaju potpunog ili delimičnog preuzimanja i daljeg korišćenja materijala koji se nalazi na sajtu, potrebno je navesti link odgovarajuće stranice na sajtu kompanije TeleTrade-a kao izvora informacija. Upotreba materijala na internetu mora biti praćena hiper linkom do web stranice teletrade.org. Automatski uvoz materijala i informacija sa stranice je zabranjen.
Ako imate bilo kakvih pitanja, obratite nam se pr@teletrade.global.
транcфери