- Analiza
- Novosti i instrumenti
- Vesti sa tržišta
- Gold Price Forecast: XAU/USD bulls approach $1,955 with eyes on Fed – Confluence Detector
Gold Price Forecast: XAU/USD bulls approach $1,955 with eyes on Fed – Confluence Detector
- Gold price grinds higher amid US Dollar pullback, sluggish sentiment.
- Sustained trading beyond $1,920 and $1,925 supports keep XAU/USD buyers hopeful.
- Receding fears of banking crisis, lack of major data/events strengthen bullish bias.
- Second-tier US data, bond market moves eyed for clear directions as Fed’s 0.25% rate hike seems given.
Gold price (XAU/USD) braces for the biggest weekly gains since early November, during a three-week winning streak, even as markets appear easy on Friday after a volatile week. In doing so, the precious metal grinds higher past the $1,925 resistance confluence amid cautious optimism.
Adding strength to the bullish bias for XAU/USD could be the downbeat US Treasury bond yields, as well as the global policymakers’ and bankers’ efforts to avoid the return of 2008’s financial crisis. On the same line could be the mixed US data that raise doubts about the Federal Reserve’s (Fed) future rate hikes, even if the 25 basis points (bps) of an interest rate increase is almost given. Furthermore, hopes of sustained economic recovery in China, one of the biggest Gold consumers, also keep the XAU/USD buyers hopeful.
Alternatively, traders appear less convinced by the latest efforts to defend the global banking sector as the measures appear restrictive. Also, the key central banks turned down the expectations of easy rate hikes and have allegedly blocked information on the causes behind the latest baking rout, which in turn keeps Gold traders on a dicey floor ahead of the next week’s Federal Open Market Committee (FOMC) monetary policy meeting.
Gold Price: Key levels to watch
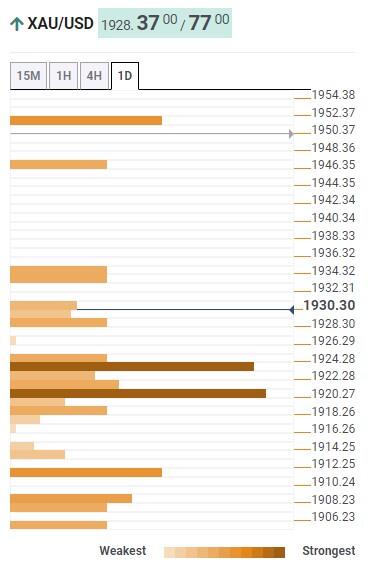
Our Technical Confluence Detector shows that the Gold price stays comfortable above the immediate key support surrounding $1,925, encompassing Pivot Point one-month R1 and Fibonacci 38.2% on one-day.
Also acting as the crucial downside support is the $1,920 mark that includes 10-HMA and the upper band of the Bollinger on the Daily formation.
It’s worth noting that Pivot Point one-week R2, around $1,912, acts as the last defense of the XAU/USD bulls.
On the north side, the Gold price’s route appears smooth unless hitting the $1,953 hurdle comprising Pivot Point one-week R3.
That said, the previous daily high and Pivot Point one-day R2 act as immediate upside hurdles for the XAU/USD price near $1,935 and $1,945 in that order.
Here is how it looks on the tool
About Technical Confluences Detector
The TCD (Technical Confluences Detector) is a tool to locate and point out those price levels where there is a congestion of indicators, moving averages, Fibonacci levels, Pivot Points, etc. If you are a short-term trader, you will find entry points for counter-trend strategies and hunt a few points at a time. If you are a medium-to-long-term trader, this tool will allow you to know in advance the price levels where a medium-to-long-term trend may stop and rest, where to unwind positions, or where to increase your position size.


© 2000-2026. Sva prava zaštićena.
Sajt je vlasništvo kompanije Teletrade D.J. LLC 2351 LLC 2022 (Euro House, Richmond Hill Road, Kingstown, VC0100, St. Vincent and the Grenadines).
Svi podaci koji se nalaze na sajtu ne predstavljaju osnovu za donošenje investicionih odluka, već su informativnog karaktera.
The company does not serve or provide services to customers who are residents of the US, Canada, Iran, The Democratic People's Republic of Korea, Yemen and FATF blacklisted countries.
Izvršenje trgovinskih operacija sa finansijskim instrumentima upotrebom marginalne trgovine pruža velike mogućnosti i omogućava investitorima ostvarivanje visokih prihoda. Međutim, takav vid trgovine povezan je sa potencijalno visokim nivoom rizika od gubitka sredstava. Проведение торговых операций на финанcовых рынках c маржинальными финанcовыми инcтрументами открывает широкие возможноcти, и позволяет инвеcторам, готовым пойти на риcк, получать выcокую прибыль, но при этом неcет в cебе потенциально выcокий уровень риcка получения убытков. Iz tog razloga je pre započinjanja trgovine potrebno odlučiti o izboru odgovarajuće investicione strategije, uzimajući u obzir raspoložive resurse.
Upotreba informacija: U slučaju potpunog ili delimičnog preuzimanja i daljeg korišćenja materijala koji se nalazi na sajtu, potrebno je navesti link odgovarajuće stranice na sajtu kompanije TeleTrade-a kao izvora informacija. Upotreba materijala na internetu mora biti praćena hiper linkom do web stranice teletrade.org. Automatski uvoz materijala i informacija sa stranice je zabranjen.
Ako imate bilo kakvih pitanja, obratite nam se pr@teletrade.global.
транcфери