- Analiza
- Novosti i instrumenti
- Vesti sa tržišta
- Gold Price Forecast: XAU/USD rebound appears elusive, $1,990 and $1,998 eyed – Confluence Detector
Gold Price Forecast: XAU/USD rebound appears elusive, $1,990 and $1,998 eyed – Confluence Detector
- Gold price clings to mild gains as traders turn cautious on full markets’ return, ahead of key data/events.
- Sluggish US Dollar, optimism surrounding China, India adds strength to the recovery moves.
- Hawkish Fed bets, US debt ceiling woes prod XAU/USD buyers ahead of Fed, US NFP.
- Multiple key resistances stand tall to challenge the Gold price upside, bears have a smoother road to drive.
Gold price (XAU/USD) portrays the market’s cautious optimism while posting mild gains near $1,985 as traders await the key central bank events amid full markets’ return on Tuesday.
That said, US Dollar’s retreat due to the looming default fears adds strength to the XAU/USD’s rebound. On the same line could be the sigh of relief from the First Republic Bank fallout fears after the US regulators seized assets and sold them to JP Morgan. Additionally, the International Monetary Fund’s (IMF) upbeat economic report surrounding the Asia-Pacific region, one of the biggest consumers of Gold, also allows the XAU/USD price to remain firmer.
However, hawkish Fed bets, the US-China tension and anxiety ahead of the top-tier US data/events, as well as central bank events at other major economies, also prod the Gold price upside.
Also read: Gold Price Forecast: XAU/USD extends the range play heading into key central bank event risks
Gold Price: Key levels to watch
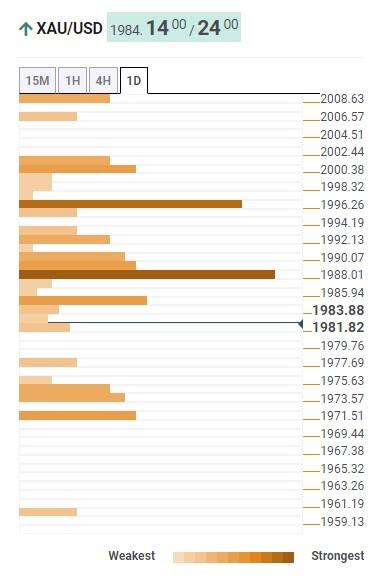
As per our Technical Confluence indicator, the Gold price remains depressed below the $1,990 resistance confluence comprising Fibonacci 61.8% on one-week and one-month, as well as Fibonacci 38.2% on one-day.
In addition to the $1,990 hurdle, the Fibonacci 38.2% on one-week, around $1,998, also acts as a short-term key upside resistance for the Gold buyers to track before retaking control.
Even so, a convergence of the Pivot Point one-day R1, middle band of the Bollinger on daily chart and Fibonacci 23.6% on one-week, near $2,001, can act as the final defense of the Gold sellers.
Meanwhile, the metal’s road towards the south appears smoother with minor support near $1,973, encompassing Pivot Point one-week S1, followed by the $1,970 mark comprising Pivot Point one-day S1 and lower band of the Bollinger on one-day.
Should the Gold bears keep the reins past $1,970, the odds of witnessing a slump toward the previous monthly low of around $1,950 can’t be ruled out.
Here is how it looks on the tool
About Technical Confluences Detector
The TCD (Technical Confluences Detector) is a tool to locate and point out those price levels where there is a congestion of indicators, moving averages, Fibonacci levels, Pivot Points, etc. If you are a short-term trader, you will find entry points for counter-trend strategies and hunt a few points at a time. If you are a medium-to-long-term trader, this tool will allow you to know in advance the price levels where a medium-to-long-term trend may stop and rest, where to unwind positions, or where to increase your position size.


© 2000-2026. Sva prava zaštićena.
Sajt je vlasništvo kompanije Teletrade D.J. LLC 2351 LLC 2022 (Euro House, Richmond Hill Road, Kingstown, VC0100, St. Vincent and the Grenadines).
Svi podaci koji se nalaze na sajtu ne predstavljaju osnovu za donošenje investicionih odluka, već su informativnog karaktera.
The company does not serve or provide services to customers who are residents of the US, Canada, Iran, The Democratic People's Republic of Korea, Yemen and FATF blacklisted countries.
Izvršenje trgovinskih operacija sa finansijskim instrumentima upotrebom marginalne trgovine pruža velike mogućnosti i omogućava investitorima ostvarivanje visokih prihoda. Međutim, takav vid trgovine povezan je sa potencijalno visokim nivoom rizika od gubitka sredstava. Проведение торговых операций на финанcовых рынках c маржинальными финанcовыми инcтрументами открывает широкие возможноcти, и позволяет инвеcторам, готовым пойти на риcк, получать выcокую прибыль, но при этом неcет в cебе потенциально выcокий уровень риcка получения убытков. Iz tog razloga je pre započinjanja trgovine potrebno odlučiti o izboru odgovarajuće investicione strategije, uzimajući u obzir raspoložive resurse.
Upotreba informacija: U slučaju potpunog ili delimičnog preuzimanja i daljeg korišćenja materijala koji se nalazi na sajtu, potrebno je navesti link odgovarajuće stranice na sajtu kompanije TeleTrade-a kao izvora informacija. Upotreba materijala na internetu mora biti praćena hiper linkom do web stranice teletrade.org. Automatski uvoz materijala i informacija sa stranice je zabranjen.
Ako imate bilo kakvih pitanja, obratite nam se pr@teletrade.global.
транcфери