- Analiza
- Novosti i instrumenti
- Vesti sa tržišta
- EUR/JPY Price Analysis: Head-and-shoulders chart pattern emerges, targets the 143.00 area
EUR/JPY Price Analysis: Head-and-shoulders chart pattern emerges, targets the 143.00 area
- EUR/JPY breaks below the two-week support trendline, confirming a head-and-shoulders chart pattern.
- The pair faces multiple support levels to target 143.20, including 50-day EMA at 146.00 and 100-day EMA at 144.59.
- Reclaiming 147.00 could open the door for gains and negate the bearish chart pattern, with the next resistance at 147.80-148.00.
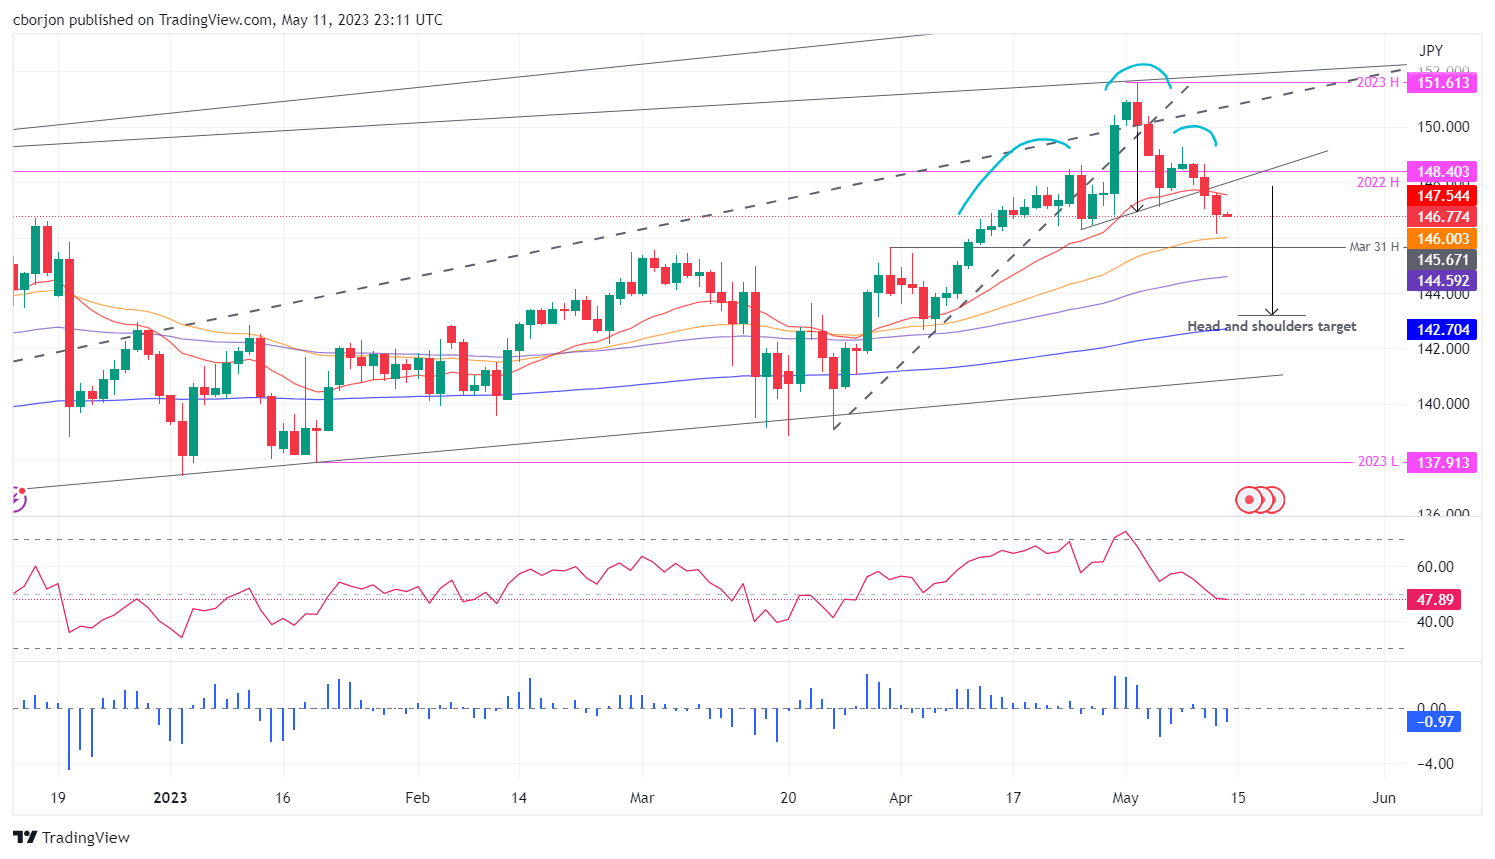
EUR/JPY confirms a break below a two-week support trendline, which also ensures the formation of a head-and-shoulders chart pattern that targets a drop of 450 pips toward 143.20, 50 pips shy of piercing the 200-day Exponential Moving Average (EMA) at 142.70. However, it should be said that it would need to hurdle support levels on its way south. As the Asian session begins, the EUR/JPY is trading at 146.85, down by 0.01%, after losing 0.46% on Thursday.
EUR/JPY Price Analysis: Technical outlook
Given the backdrop, the GBP/JPY confirmed the formation of a head-and-shoulders chart pattern. Even though it is a bearish chart pattern, sellers must reclaim several demand areas on its way toward the 143.00 figure.
The EUR/JPY first support would be the 50-day Exponential Moving Average (EMA) at 146.00. A breach of the latter would sponsor a fall to the 100-day EMA at 144.59 before testing the 144.00 psychological level. Once cleared, the head-and-shoulders profit target of 143.20 should be reached.
The Relative Strength Index (RSI) indicator turned bearish, warranting that further downside is expected, while the 3-day Rate of Change (RoC), continues to slide below its neutral level.
Conversely, if EUR/JPY buyers reclaim 147.00, that could open the door for further gains. The next supply area to test would be the head-and-shoulders neckline at around 147.80-148.00, before reaching towards the last year’s high of 148.40, negating the bearish chart pattern.
Trend: Downward biased.
EUR/JPY Price Action – Daily Chart


© 2000-2026. Sva prava zaštićena.
Sajt je vlasništvo kompanije Teletrade D.J. LLC 2351 LLC 2022 (Euro House, Richmond Hill Road, Kingstown, VC0100, St. Vincent and the Grenadines).
Svi podaci koji se nalaze na sajtu ne predstavljaju osnovu za donošenje investicionih odluka, već su informativnog karaktera.
The company does not serve or provide services to customers who are residents of the US, Canada, Iran, The Democratic People's Republic of Korea, Yemen and FATF blacklisted countries.
Izvršenje trgovinskih operacija sa finansijskim instrumentima upotrebom marginalne trgovine pruža velike mogućnosti i omogućava investitorima ostvarivanje visokih prihoda. Međutim, takav vid trgovine povezan je sa potencijalno visokim nivoom rizika od gubitka sredstava. Проведение торговых операций на финанcовых рынках c маржинальными финанcовыми инcтрументами открывает широкие возможноcти, и позволяет инвеcторам, готовым пойти на риcк, получать выcокую прибыль, но при этом неcет в cебе потенциально выcокий уровень риcка получения убытков. Iz tog razloga je pre započinjanja trgovine potrebno odlučiti o izboru odgovarajuće investicione strategije, uzimajući u obzir raspoložive resurse.
Upotreba informacija: U slučaju potpunog ili delimičnog preuzimanja i daljeg korišćenja materijala koji se nalazi na sajtu, potrebno je navesti link odgovarajuće stranice na sajtu kompanije TeleTrade-a kao izvora informacija. Upotreba materijala na internetu mora biti praćena hiper linkom do web stranice teletrade.org. Automatski uvoz materijala i informacija sa stranice je zabranjen.
Ako imate bilo kakvih pitanja, obratite nam se pr@teletrade.global.
транcфери