- Analiza
- Novosti i instrumenti
- Vesti sa tržišta
- AUD/USD Price Analysis: Faces selling pressure near 0.6660 amid mixed Australian Wage Price Index data
AUD/USD Price Analysis: Faces selling pressure near 0.6660 amid mixed Australian Wage Price Index data
- AUD/USD has sensed selling pressure near 0.6660 amid mixed Aussie Wage Price Index data.
- Quarterly labor cost index missed estimates, however, annual data outperformed the consensus.
- The approval for raising the US borrowing cap postponed again to the end of the week.
The AUD/USD pair has sensed selling pressure near 0.6660 as the Australian Bureau of Statistics has reported mixed Q1 Wage Price Index data. Quarterly labor cost index has remained steady at 0.8% but lower than the estimate of 0.9%. On an annual basis, the economic data has accelerated to 3.7% vs. the consensus of 3.6% and the former release of 3.3%. This might allow the Reserve Bank of Australia (RBA) to keep interest rates steady at 3.85%.
Earlier, the Aussie asset remained sideways despite the approval for raising the US borrowing cap being postponed again to the end of the week. However, one thing is clear the default is not an option now as each delegate has considered it as a disaster.
Meanwhile, the US Dollar Index (DXY) is showing signs of volatility contraction after failing in extending its recovery above 102.70.
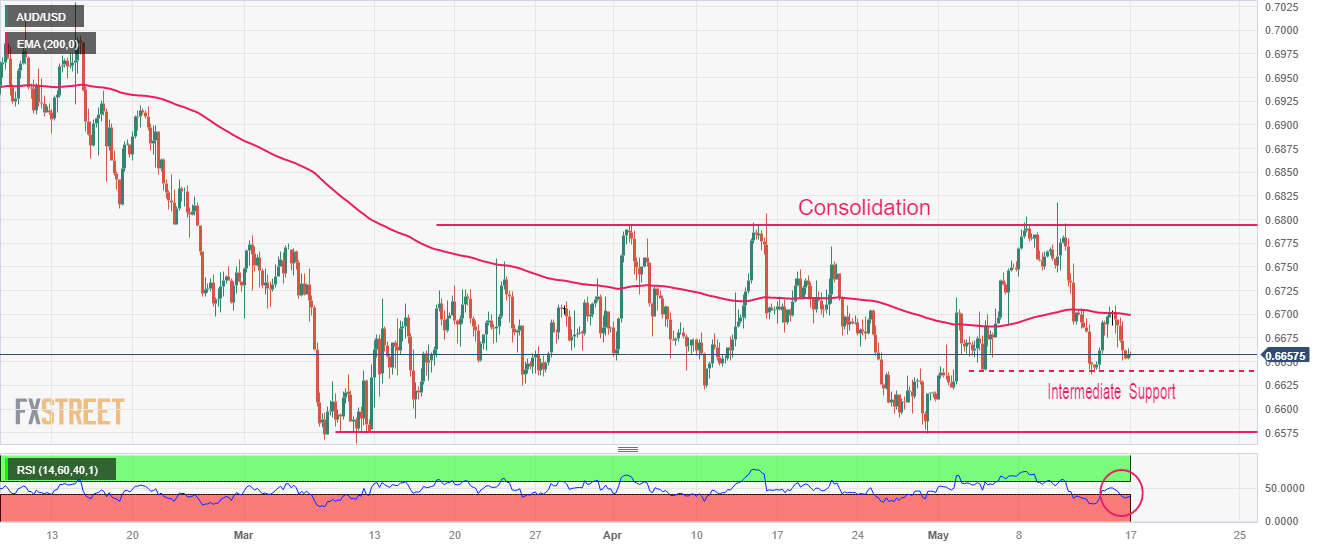
Scrutiny of AUD/USD’s four-hour scale indicates that the upside is capped from April 14 high around 0.6806 while the downside is restricted from March 07 low around 0.6580. Intermediate support is plotted from May 03 low around 0.6640. The 200-period Exponential Moving Average (EMA) at 0.6700 is indicating a sideways trend.
Meanwhile, the Relative Strength Index (RSI) (14) has rebounded from 40.00, indicating weak downside bias.
An acceptance above the round-level resistance at 0.6800 confidently, Australian Dollar bulls will firmly drive the asset higher toward February 06 low at 0.6855 followed by February 21 high at 0.6920.
In an alternate scenario, US Dollar bulls will flex their muscles if the Aussie asset will drop below March 15 low at 0.6590. An occurrence of the same will expose the asset to March 08 low at 0.6568 followed by 02 November 2022 high around 0.6500.
AUD/USD four-hour chart


© 2000-2026. Sva prava zaštićena.
Sajt je vlasništvo kompanije Teletrade D.J. LLC 2351 LLC 2022 (Euro House, Richmond Hill Road, Kingstown, VC0100, St. Vincent and the Grenadines).
Svi podaci koji se nalaze na sajtu ne predstavljaju osnovu za donošenje investicionih odluka, već su informativnog karaktera.
The company does not serve or provide services to customers who are residents of the US, Canada, Iran, The Democratic People's Republic of Korea, Yemen and FATF blacklisted countries.
Izvršenje trgovinskih operacija sa finansijskim instrumentima upotrebom marginalne trgovine pruža velike mogućnosti i omogućava investitorima ostvarivanje visokih prihoda. Međutim, takav vid trgovine povezan je sa potencijalno visokim nivoom rizika od gubitka sredstava. Проведение торговых операций на финанcовых рынках c маржинальными финанcовыми инcтрументами открывает широкие возможноcти, и позволяет инвеcторам, готовым пойти на риcк, получать выcокую прибыль, но при этом неcет в cебе потенциально выcокий уровень риcка получения убытков. Iz tog razloga je pre započinjanja trgovine potrebno odlučiti o izboru odgovarajuće investicione strategije, uzimajući u obzir raspoložive resurse.
Upotreba informacija: U slučaju potpunog ili delimičnog preuzimanja i daljeg korišćenja materijala koji se nalazi na sajtu, potrebno je navesti link odgovarajuće stranice na sajtu kompanije TeleTrade-a kao izvora informacija. Upotreba materijala na internetu mora biti praćena hiper linkom do web stranice teletrade.org. Automatski uvoz materijala i informacija sa stranice je zabranjen.
Ako imate bilo kakvih pitanja, obratite nam se pr@teletrade.global.
транcфери