- Analiza
- Novosti i instrumenti
- Vesti sa tržišta
- GBP/USD Price Analysis: Follows the footprints of sideways US Dollar Index
GBP/USD Price Analysis: Follows the footprints of sideways US Dollar Index
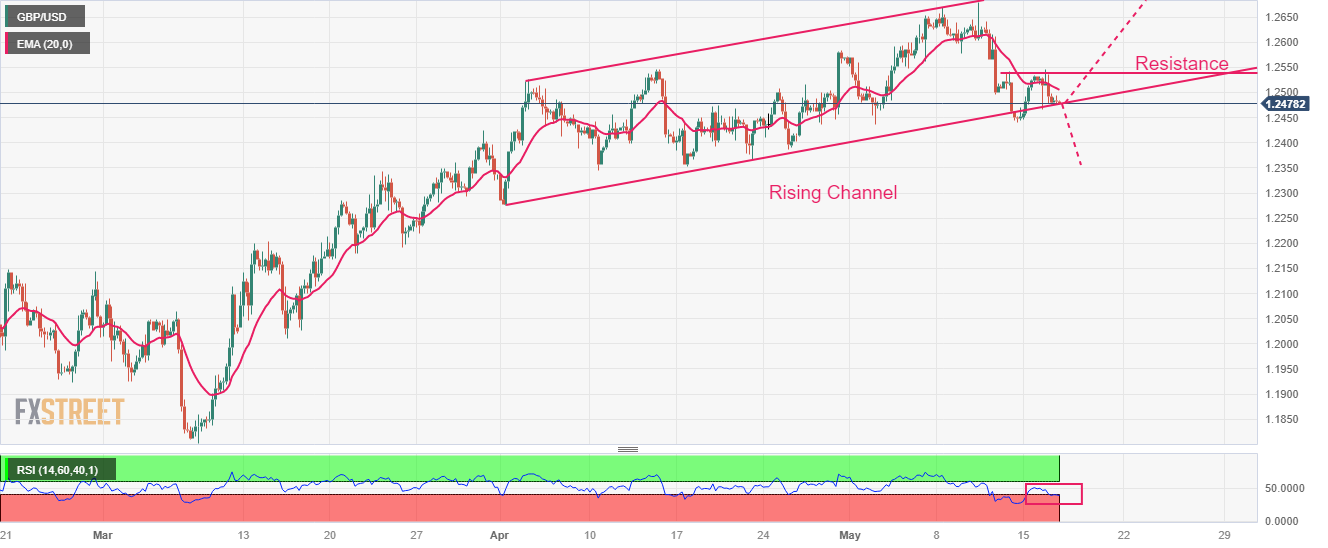
- GBP/USD is juggling in a narrow range above 1.2480 amid sideways performance by the USD Index.
- Weak UK Employment data has provided some relief to BoE policymakers.
- GBP/USD is hovering near the lower portion of the Rising Channel pattern plotted at 1.2276.
The GBP/USD pair is demonstrating a back-and-forth action above 1.2480 in the early European session. The Cable is struggling to find any decisive move, following the footprints of the sideways US Dollar Index (DXY). The US Dollar Index (DXY) is auctioning topsy-turvy below the immediate resistance of 102.70.
The FX domain failed to show any action despite discussions over the US debt-ceiling postponed further to later this week. However, US President Joe Biden has cleared that he will remain in touch with Speaker McCarthy each day to resolve negotiations.
Meanwhile, weak United Kingdom Employment data has provided some relief to Bank of England (BoE) policymakers. Investors should note that labor shortages and historically high food inflation have remained major catalysts for double-digit UK inflation.
GBP/USD is hovering near the lower portion of the Rising Channel chart pattern plotted from April 03 low at 1.2276. The upper portion of the aforementioned chart pattern is placed from April 04 high at 1.2525. The 20-period Exponential Moving Average (EMA) has restricted the upside of the Pound Sterling.
The Relative Strength Index (RSI) (14) seems vulnerable in the 40.00-60.00 range, A sharp slippage below 40.00 will trigger the downside momentum.
A downside move below May 12 low at 1.2440 will trigger a breakdown of the Rising Channel pattern and will expose the Cable to April 21 low at 1.2367 followed by April 03 low at 1.2276.
On the flip side, a recovery move above May 09 high at 1.2640 will drive the major toward the round-level resistance at 1.2700 and 26 April 2022 high at 1.2772.
GBP/USD four-hour chart


© 2000-2026. Sva prava zaštićena.
Sajt je vlasništvo kompanije Teletrade D.J. LLC 2351 LLC 2022 (Euro House, Richmond Hill Road, Kingstown, VC0100, St. Vincent and the Grenadines).
Svi podaci koji se nalaze na sajtu ne predstavljaju osnovu za donošenje investicionih odluka, već su informativnog karaktera.
The company does not serve or provide services to customers who are residents of the US, Canada, Iran, The Democratic People's Republic of Korea, Yemen and FATF blacklisted countries.
Izvršenje trgovinskih operacija sa finansijskim instrumentima upotrebom marginalne trgovine pruža velike mogućnosti i omogućava investitorima ostvarivanje visokih prihoda. Međutim, takav vid trgovine povezan je sa potencijalno visokim nivoom rizika od gubitka sredstava. Проведение торговых операций на финанcовых рынках c маржинальными финанcовыми инcтрументами открывает широкие возможноcти, и позволяет инвеcторам, готовым пойти на риcк, получать выcокую прибыль, но при этом неcет в cебе потенциально выcокий уровень риcка получения убытков. Iz tog razloga je pre započinjanja trgovine potrebno odlučiti o izboru odgovarajuće investicione strategije, uzimajući u obzir raspoložive resurse.
Upotreba informacija: U slučaju potpunog ili delimičnog preuzimanja i daljeg korišćenja materijala koji se nalazi na sajtu, potrebno je navesti link odgovarajuće stranice na sajtu kompanije TeleTrade-a kao izvora informacija. Upotreba materijala na internetu mora biti praćena hiper linkom do web stranice teletrade.org. Automatski uvoz materijala i informacija sa stranice je zabranjen.
Ako imate bilo kakvih pitanja, obratite nam se pr@teletrade.global.
транcфери