- Analiza
- Novosti i instrumenti
- Vesti sa tržišta
- Silver Price Analysis: XAG/USD floats around $23.60, as high US bond yields dented
Silver Price Analysis: XAG/USD floats around $23.60, as high US bond yields dented
- Silver prices edge toward $23.60 following a dip below $24.00 last week, as US Treasury bond yields surge to 3.721%, curbing safe-haven appetite and softening the USD’s fall.
- XAG/USD holds its double-top chart pattern below the neckline. Although a failure to cross the 100-day EMA at $23.50 hints at the bullish sentiment, a bearish RSI suggests possible retesting.
- If XAG/USD breaks below the 100-day EMA, it eyes $23.00 and then the pivotal 200-day EMA at $22.82.
Silver price retraces toward the $23.60 area after falling below the $24.00 figure in the last week, courtesy of higher US Treasury bond yields, with the 10-year benchmark note rate at 3.721%, climbing more than four basis points. That dented the appetite for safe-haven assets, namely Gold and Silver prices, and cushioned the fall of the US Dollar. At the time of writing, the XAG/USD is trading at $23.62, almost flat as the Asian session begins.
XAG/USD Price Analysis: Technical outlook
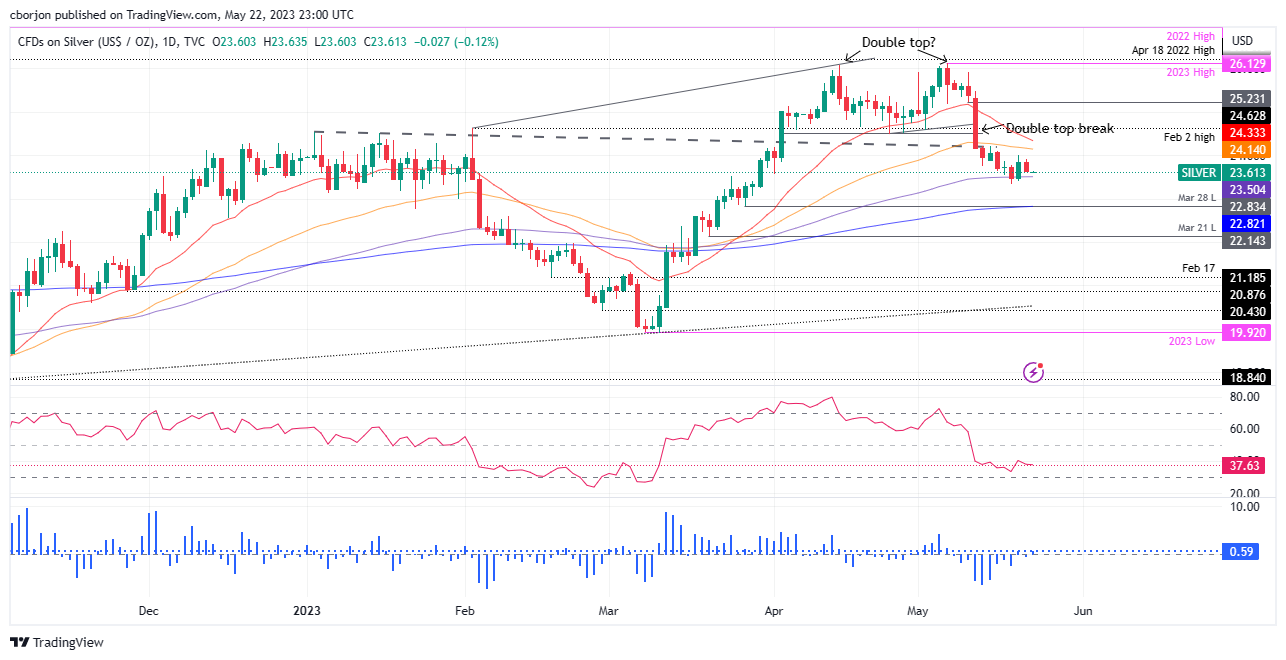
The XAG/USD continues to validate a double-top chart pattern, with the XAG/USD’s spot price remaining below the double-top neckline. Failure to break below the 100-day Exponential Moving Average (EMA) at $23.50 keeps Silver buyers hopeful for higher prices. Nevertheless, the Relative Strength Index (RSI) indicator remains bearish, suggesting that the 100-day EMA could be retested soon.
If XAG/USD breaks below the latter, the next support would be the $23.00 figure before testing the “trendsetter” 200-day EMA at $22.82. Once broken, XAG/USD will turn bearish and be exposed to test lower prices. Firstly, the March 28 daily low at $22.83, followed by the March 21 swing low of $22.14.
On the other hand, for XAG/USD’s bullish continuation, Silver must reclaim the $24.00 mark, a troy ounce, followed by the 50-day EMA at $24.14. Once cleared, XAG/USD’s next resistance would be the 20-day EMA at $24.33, ahead of double-top neckline cracking.
XAG/USD Price Action – Daily chart


© 2000-2026. Sva prava zaštićena.
Sajt je vlasništvo kompanije Teletrade D.J. LLC 2351 LLC 2022 (Euro House, Richmond Hill Road, Kingstown, VC0100, St. Vincent and the Grenadines).
Svi podaci koji se nalaze na sajtu ne predstavljaju osnovu za donošenje investicionih odluka, već su informativnog karaktera.
The company does not serve or provide services to customers who are residents of the US, Canada, Iran, The Democratic People's Republic of Korea, Yemen and FATF blacklisted countries.
Izvršenje trgovinskih operacija sa finansijskim instrumentima upotrebom marginalne trgovine pruža velike mogućnosti i omogućava investitorima ostvarivanje visokih prihoda. Međutim, takav vid trgovine povezan je sa potencijalno visokim nivoom rizika od gubitka sredstava. Проведение торговых операций на финанcовых рынках c маржинальными финанcовыми инcтрументами открывает широкие возможноcти, и позволяет инвеcторам, готовым пойти на риcк, получать выcокую прибыль, но при этом неcет в cебе потенциально выcокий уровень риcка получения убытков. Iz tog razloga je pre započinjanja trgovine potrebno odlučiti o izboru odgovarajuće investicione strategije, uzimajući u obzir raspoložive resurse.
Upotreba informacija: U slučaju potpunog ili delimičnog preuzimanja i daljeg korišćenja materijala koji se nalazi na sajtu, potrebno je navesti link odgovarajuće stranice na sajtu kompanije TeleTrade-a kao izvora informacija. Upotreba materijala na internetu mora biti praćena hiper linkom do web stranice teletrade.org. Automatski uvoz materijala i informacija sa stranice je zabranjen.
Ako imate bilo kakvih pitanja, obratite nam se pr@teletrade.global.
транcфери