- Analiza
- Novosti i instrumenti
- Vesti sa tržišta
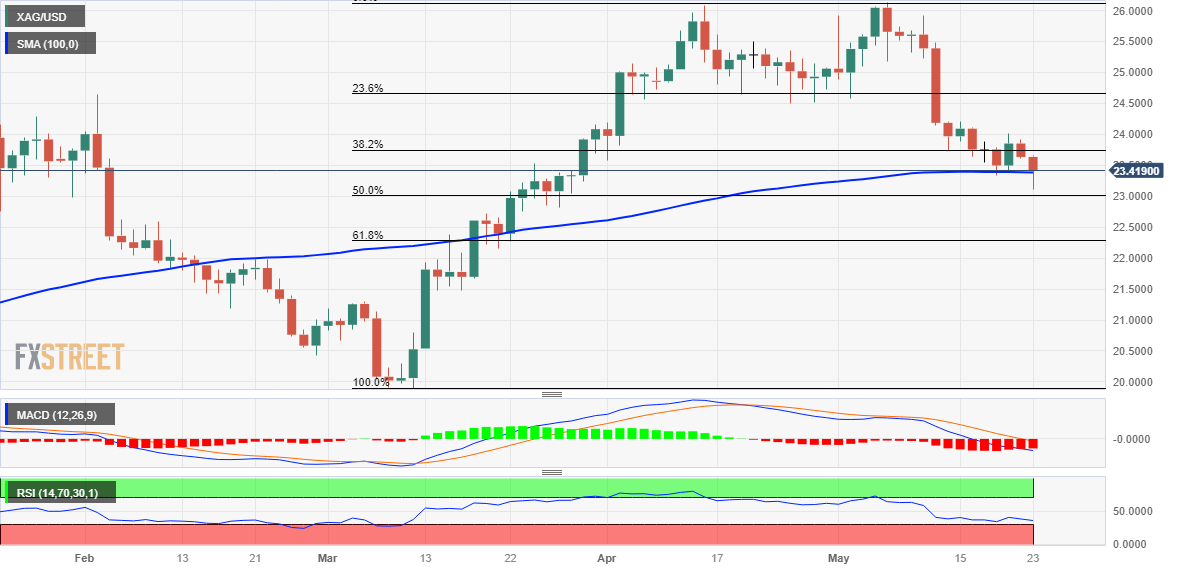
- Silver Price Analysis: XAG/USD bears have the upper hand below 100-day SMA
Silver Price Analysis: XAG/USD bears have the upper hand below 100-day SMA
- Silver breaks through the 100-day SMA support and drops to a nearly two-month low.
- The technical setup favours bearish traders and supports prospects for further losses.
- A sustained strength beyond the $24.00 mark is needed to negate the bearish outlook.
Silver continues losing ground for the second successive day on Tuesday and confirms a fresh bearish breakdown through the 100-day Simple Moving Average (SMA). The white metal maintains its heavily offered tone through the early North American session and currently trades around the $23.25-$23.30 region, just above a nearly two-month low.
The recent repeated failures near the $24.00 round-figure mark and the subsequent slide below a technically significant moving average could be seen as a fresh trigger for bearish traders. Moreover, oscillators on the daily chart are holding deep in the negative territory and are still far from being in the oversold zone. This, in turn, supports prospects for an extension of the recent retracement slide from over a one-year top, around the $26.15 region touched earlier this month.
Some follow-through selling below the $23.00 mark, which coincides with the 50% Fibonacci retracement level of the March-May rally, will reaffirm the negative outlook. The XAG/USD might then accelerate the fall towards intermediate support near the $22.60-$22.55 region before eventually dropping to the 61.8% Fibo. level, around the $22.25-$22.20 region. This is followed by the $22.00 mark, which if broken decisively will set the stage for a further near-term depreciating move.
On the flip side, attempted recovery back above the 100-day SMA, currently around the $23.35 region, is more likely to attract fresh sellers near the 38.2% Fibo. level, around the $23.75 area. This, in turn, should cap the upside for the XAG/USD near the $24.00 round-figure mark. Some follow-through buying beyond the $24.20-$24.25 region, however, might negate the near-term bearish outlook and prompt an aggressive short-covering rally towards the $25.00 psychological mark.
Silver daily chart
Key levels to watch


© 2000-2026. Sva prava zaštićena.
Sajt je vlasništvo kompanije Teletrade D.J. LLC 2351 LLC 2022 (Euro House, Richmond Hill Road, Kingstown, VC0100, St. Vincent and the Grenadines).
Svi podaci koji se nalaze na sajtu ne predstavljaju osnovu za donošenje investicionih odluka, već su informativnog karaktera.
The company does not serve or provide services to customers who are residents of the US, Canada, Iran, The Democratic People's Republic of Korea, Yemen and FATF blacklisted countries.
Izvršenje trgovinskih operacija sa finansijskim instrumentima upotrebom marginalne trgovine pruža velike mogućnosti i omogućava investitorima ostvarivanje visokih prihoda. Međutim, takav vid trgovine povezan je sa potencijalno visokim nivoom rizika od gubitka sredstava. Проведение торговых операций на финанcовых рынках c маржинальными финанcовыми инcтрументами открывает широкие возможноcти, и позволяет инвеcторам, готовым пойти на риcк, получать выcокую прибыль, но при этом неcет в cебе потенциально выcокий уровень риcка получения убытков. Iz tog razloga je pre započinjanja trgovine potrebno odlučiti o izboru odgovarajuće investicione strategije, uzimajući u obzir raspoložive resurse.
Upotreba informacija: U slučaju potpunog ili delimičnog preuzimanja i daljeg korišćenja materijala koji se nalazi na sajtu, potrebno je navesti link odgovarajuće stranice na sajtu kompanije TeleTrade-a kao izvora informacija. Upotreba materijala na internetu mora biti praćena hiper linkom do web stranice teletrade.org. Automatski uvoz materijala i informacija sa stranice je zabranjen.
Ako imate bilo kakvih pitanja, obratite nam se pr@teletrade.global.
транcфери