- Analiza
- Novosti i instrumenti
- Vesti sa tržišta
- EUR/USD Price Analysis: Stumbled to two-month low around 1.0700
EUR/USD Price Analysis: Stumbled to two-month low around 1.0700
- EUR/USD dips to 1.0707 amidst soaring US Treasury bond yields, but mixed market sentiment prevents a steeper fall.
- The pair could witness further losses if sellers successfully reclaim the 1.0700 mark, shifting the bias downward.
- Staying above 1.0700 could lead to a EUR/USD comeback, with 1.0900 in sight if key resistance levels are broken.
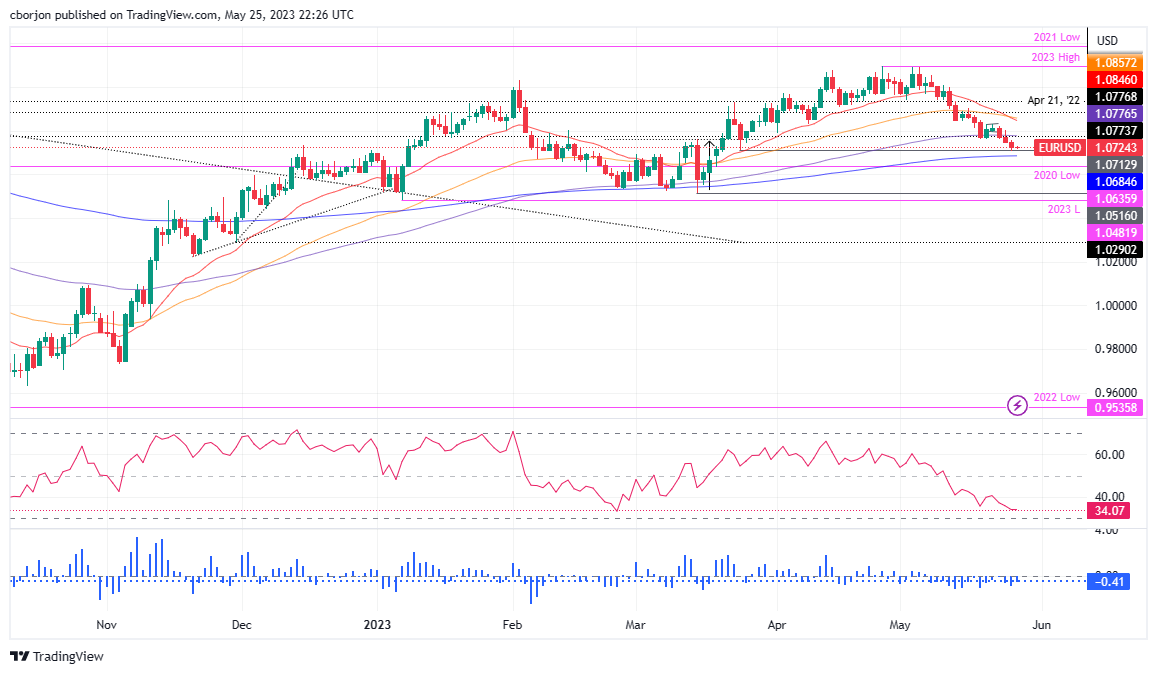
EUR/USD hit a new two-month low at around 1.0707, though it remains neutral to downward biased unless the pair suffers more weakness, which could send the EUR/USD sinking below the 1.0700 mark toward the 200-day Exponential Moving Average (EMA) at 1.0684. Nevertheless, a mixed market sentiment capped the Euro{s (EUR) fall, even though US Treasury bond yields skyrocketed, underpinning the US Dollar (USD). As the Asian session begins, the EUR/USD trades at 1.0727, up 0.02%.
EUR/USD Price Analysis: Technical outlook
Two days ago, the EUR/USD slumped below the 100-day Exponential Moving Average (EMA) at 1.0776, with sellers taking advantage of it, as the EUR/USD registered three straight sessions of losses. Although the pair will likely print additional losses, sellers must reclaim the 1.0700. That would leave the pair exposed, and once the EUR/USD dives below the 200-day EMA, that would shift the pair bias downwards.
That said, the EUR/USD first support would be the 2020 yearly low of 1.0636, ahead of falling to 1.0600. Break below will expose the March 15 daily low of 1.0516 before dropping to the year-to-date (YTD) low of 1.0482.
Conversely, if EUR/USD stays afloat above 1.0700, the EUR/USD could stage a comeback, initially to the 100-day EMA at 1.0776. A breach of the letter will expose 1.0800 before the EUR/USD threatens the confluence of technical indicators, like the 50 and 20-day EMAs, at around 1.0845-1.0857. Once the intersection gives way, 1.0900 is on the cards.
EUR/USD Price Action – Daily chart


© 2000-2026. Sva prava zaštićena.
Sajt je vlasništvo kompanije Teletrade D.J. LLC 2351 LLC 2022 (Euro House, Richmond Hill Road, Kingstown, VC0100, St. Vincent and the Grenadines).
Svi podaci koji se nalaze na sajtu ne predstavljaju osnovu za donošenje investicionih odluka, već su informativnog karaktera.
The company does not serve or provide services to customers who are residents of the US, Canada, Iran, The Democratic People's Republic of Korea, Yemen and FATF blacklisted countries.
Izvršenje trgovinskih operacija sa finansijskim instrumentima upotrebom marginalne trgovine pruža velike mogućnosti i omogućava investitorima ostvarivanje visokih prihoda. Međutim, takav vid trgovine povezan je sa potencijalno visokim nivoom rizika od gubitka sredstava. Проведение торговых операций на финанcовых рынках c маржинальными финанcовыми инcтрументами открывает широкие возможноcти, и позволяет инвеcторам, готовым пойти на риcк, получать выcокую прибыль, но при этом неcет в cебе потенциально выcокий уровень риcка получения убытков. Iz tog razloga je pre započinjanja trgovine potrebno odlučiti o izboru odgovarajuće investicione strategije, uzimajući u obzir raspoložive resurse.
Upotreba informacija: U slučaju potpunog ili delimičnog preuzimanja i daljeg korišćenja materijala koji se nalazi na sajtu, potrebno je navesti link odgovarajuće stranice na sajtu kompanije TeleTrade-a kao izvora informacija. Upotreba materijala na internetu mora biti praćena hiper linkom do web stranice teletrade.org. Automatski uvoz materijala i informacija sa stranice je zabranjen.
Ako imate bilo kakvih pitanja, obratite nam se pr@teletrade.global.
транcфери