- Analiza
- Novosti i instrumenti
- Vesti sa tržišta
- Silver Price Analysis: XAG/USD resiliently rebounds, claims $23.00 amidst high US bond yields
Silver Price Analysis: XAG/USD resiliently rebounds, claims $23.00 amidst high US bond yields
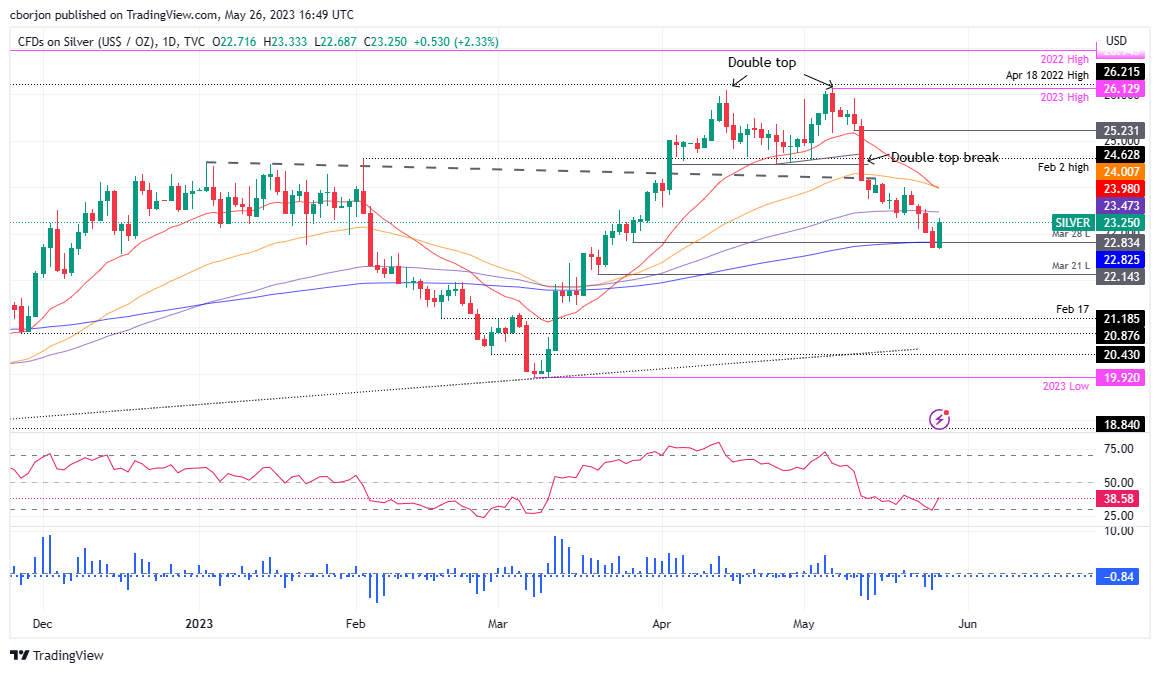
- Silver price returns from two-month lows, crosses the 200-day EMA and $23 threshold and ends the week with a 2.89% loss.
- Despite US data supporting another Fed rate hike and subsequent rise in Treasury bond yields, silver price sustains an upward trajectory, targeting the 100-day EMA.
- With the Relative Strength Index indicating potential silver weakness, downside risk remains.
Silver price bounces off two-month-lows hit at $22.68, rallies sharply, and claims the 200-day Exponential Moving Average (EMA) at $22.82 and the $23.00 psychological figure on Friday’s mid-North American session. Although the white metal is gaining more than 1.90%, it is set to finish the week with losses of 2.89%. At the time of writing, XAG/USD is trading at $23.15.
Silver Price Analysis: XAG/USD technical outlook
Even though economic data from the United States (US) justifies another rate hike by the US Federal Reserve (Fed). Therefore, US Treasury bond yields are rising, underpinning the greenback. However, the XAG/USD ignored most factors that could drag the price low and rip higher, eyeing the 100-day Exponential Moving Average (EMA) at $23.47.
Nevertheless, the Relative Strength Index (RSI) is in bearish territory, warranting further Silver weakness, while the 3-day Rate of Change (RoC) has yet to reach neutral levels. Therefore, additional downside could be expected.
However, if XAG/USD clears the 100-day EMA, it would face sold resistance at the confluence of the 20 and 50-day EMAs at around $23.97-24.00. Once broken, the next supply zone would be the $25.00 mark.
On the flip side, and the path of least resistance in the near term, the XAG/USD first support would be $23.00, followed by $22.68, the current week’s low. A beach of the latter will expose the March 21 swing low of $22.14.
Silver Price Action – Daily chart


© 2000-2026. Sva prava zaštićena.
Sajt je vlasništvo kompanije Teletrade D.J. LLC 2351 LLC 2022 (Euro House, Richmond Hill Road, Kingstown, VC0100, St. Vincent and the Grenadines).
Svi podaci koji se nalaze na sajtu ne predstavljaju osnovu za donošenje investicionih odluka, već su informativnog karaktera.
The company does not serve or provide services to customers who are residents of the US, Canada, Iran, The Democratic People's Republic of Korea, Yemen and FATF blacklisted countries.
Izvršenje trgovinskih operacija sa finansijskim instrumentima upotrebom marginalne trgovine pruža velike mogućnosti i omogućava investitorima ostvarivanje visokih prihoda. Međutim, takav vid trgovine povezan je sa potencijalno visokim nivoom rizika od gubitka sredstava. Проведение торговых операций на финанcовых рынках c маржинальными финанcовыми инcтрументами открывает широкие возможноcти, и позволяет инвеcторам, готовым пойти на риcк, получать выcокую прибыль, но при этом неcет в cебе потенциально выcокий уровень риcка получения убытков. Iz tog razloga je pre započinjanja trgovine potrebno odlučiti o izboru odgovarajuće investicione strategije, uzimajući u obzir raspoložive resurse.
Upotreba informacija: U slučaju potpunog ili delimičnog preuzimanja i daljeg korišćenja materijala koji se nalazi na sajtu, potrebno je navesti link odgovarajuće stranice na sajtu kompanije TeleTrade-a kao izvora informacija. Upotreba materijala na internetu mora biti praćena hiper linkom do web stranice teletrade.org. Automatski uvoz materijala i informacija sa stranice je zabranjen.
Ako imate bilo kakvih pitanja, obratite nam se pr@teletrade.global.
транcфери