- Analiza
- Novosti i instrumenti
- Vesti sa tržišta
- USD/CAD Price Analysis: At make or a break below 1.3600
USD/CAD Price Analysis: At make or a break below 1.3600
- USD/CAD is oscillating in a narrow range below 1.3600 amid a quiet market mood.
- This week, US Employment-linked economic indicators will keep investors busy.
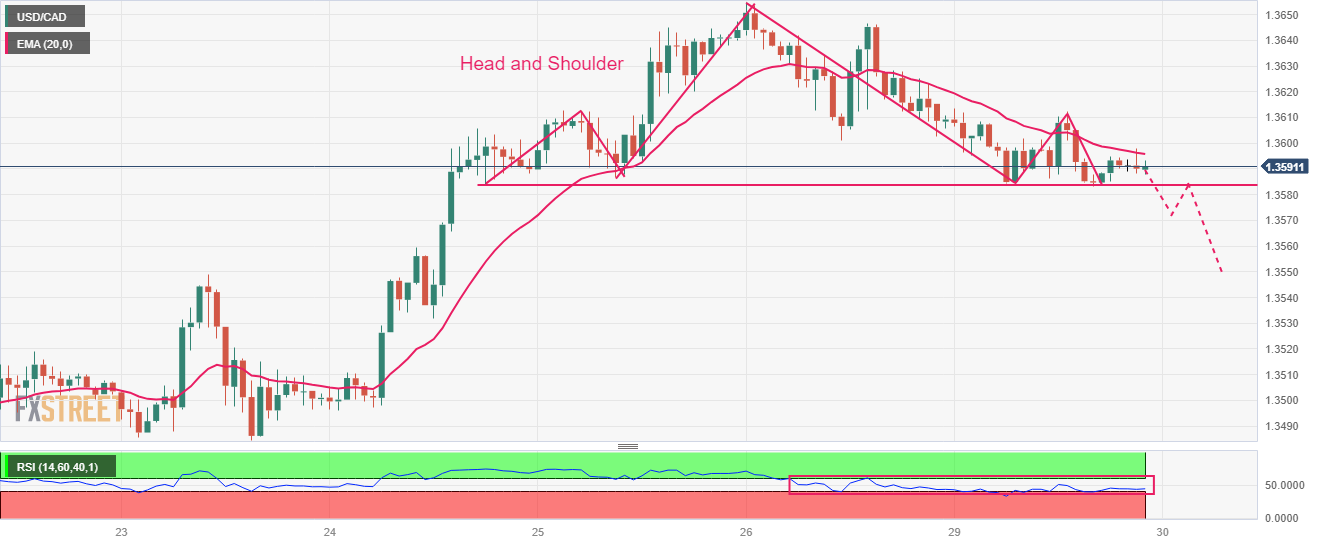
- USD/CAD is hovering near the neckline of the Head and Shoulder chart pattern around 1.3584.
The USD/CAD pair is juggling in a narrow range below the round-level resistance of 1.3600 in the early Tokyo session. The Loonie asset is expected to display a power-pack action as investors would remain highly active after an extended weekend.
As US debt-ceiling raise proposal is finally going to Congress for approval before June 05, investors would shift their focus towards United States Employment-linked economic indicators. After Wednesday’s JOLTS Job Openings data, investors will focus on Thursday’s Automatic Data Processing (ADP) Employment Change and finally on Friday’s Nonfarm Payrolls (NFP) data.
The Canadian Dollar is expected to remain on the tenterhooks amid the release of the Q1 Gross Domestic Product (GDP) data, which will release on Wednesday.
Meanwhile, the US Dollar Index (DXY) has dropped after facing stiff barricades around 104.30.
USD/CAD is hovering near the neckline of the Head and Shoulder chart pattern formed on an hourly scale, which is plotted around 1.3584. A slippage below the neckline support would result in a sheer breakdown. The 20-period Exponential Moving Average (EMA) at 1.3596 is acting as a barricade for the US Dollar bulls.
Meanwhile, the Relative Strength Index (RSI) (14) is oscillating in the 40.00-60.00 range. A downside momentum will get triggered after a breakdown below 40.00.
Going forward, a break below May 29 low at 1.3584 will drag the asset toward May 23 high at 1.3550. A breakdown below the latter will expose the Loonie asset to psychological support at 1.3500.
On the contrary, a fresh buy would come above May 26 high at 1.3655, which would drive the asset toward the round-level resistance at 1.3700 followed by March 27 high at 1.3745.
USD/CAD hourly chart


© 2000-2026. Sva prava zaštićena.
Sajt je vlasništvo kompanije Teletrade D.J. LLC 2351 LLC 2022 (Euro House, Richmond Hill Road, Kingstown, VC0100, St. Vincent and the Grenadines).
Svi podaci koji se nalaze na sajtu ne predstavljaju osnovu za donošenje investicionih odluka, već su informativnog karaktera.
The company does not serve or provide services to customers who are residents of the US, Canada, Iran, The Democratic People's Republic of Korea, Yemen and FATF blacklisted countries.
Izvršenje trgovinskih operacija sa finansijskim instrumentima upotrebom marginalne trgovine pruža velike mogućnosti i omogućava investitorima ostvarivanje visokih prihoda. Međutim, takav vid trgovine povezan je sa potencijalno visokim nivoom rizika od gubitka sredstava. Проведение торговых операций на финанcовых рынках c маржинальными финанcовыми инcтрументами открывает широкие возможноcти, и позволяет инвеcторам, готовым пойти на риcк, получать выcокую прибыль, но при этом неcет в cебе потенциально выcокий уровень риcка получения убытков. Iz tog razloga je pre započinjanja trgovine potrebno odlučiti o izboru odgovarajuće investicione strategije, uzimajući u obzir raspoložive resurse.
Upotreba informacija: U slučaju potpunog ili delimičnog preuzimanja i daljeg korišćenja materijala koji se nalazi na sajtu, potrebno je navesti link odgovarajuće stranice na sajtu kompanije TeleTrade-a kao izvora informacija. Upotreba materijala na internetu mora biti praćena hiper linkom do web stranice teletrade.org. Automatski uvoz materijala i informacija sa stranice je zabranjen.
Ako imate bilo kakvih pitanja, obratite nam se pr@teletrade.global.
транcфери