- Analiza
- Novosti i instrumenti
- Vesti sa tržišta
- Silver Price Analysis: XAG/USD climbs above $23.50 amidst dovish Fed remarks, falling US bond yields
Silver Price Analysis: XAG/USD climbs above $23.50 amidst dovish Fed remarks, falling US bond yields
- XAG/USD ascends past the 100-day EMA, powered by dovish remarks from Fed officials and reduced US Treasury yields.
- The technical outlook indicates potential resistance at 20-day and 50-day EMA, respectively, and support at 100-day and 200-day EMAs
- Further upside is expected based on the RSI and 3-period RoC, although key pivot points and daily highs need to be breached for significant gain.
Silver price climbs past the 100-day Exponential Moving Average (EMA) and trades back above the $23.50 area, sponsored by several factors. Firstly, US Federal Reserve (Fed) Vice-Chairman nominee Philip Jefferson delivered dovish remarks alongside Philadelphia Fed’s Patrick Harker, while confidence about passing the US debt-ceiling bill triggered a fall in US Treasury bond yields.
XAG/USD Price Analysis: Technical outlook
From a daily chart perspective, XAG/USD is neutral to upward biased, capped on the upside by the confluence of two daily EMAs: the 20-day at $23.80 and the 50-day at $23.93. Upside risks lie above those levels, exposing the $24.00 figure. Conversely, XAG/USD sellers claiming the 100-day EMA at $23.46 could threaten to challenge the 200-day EMA at $22.84 for the third time.
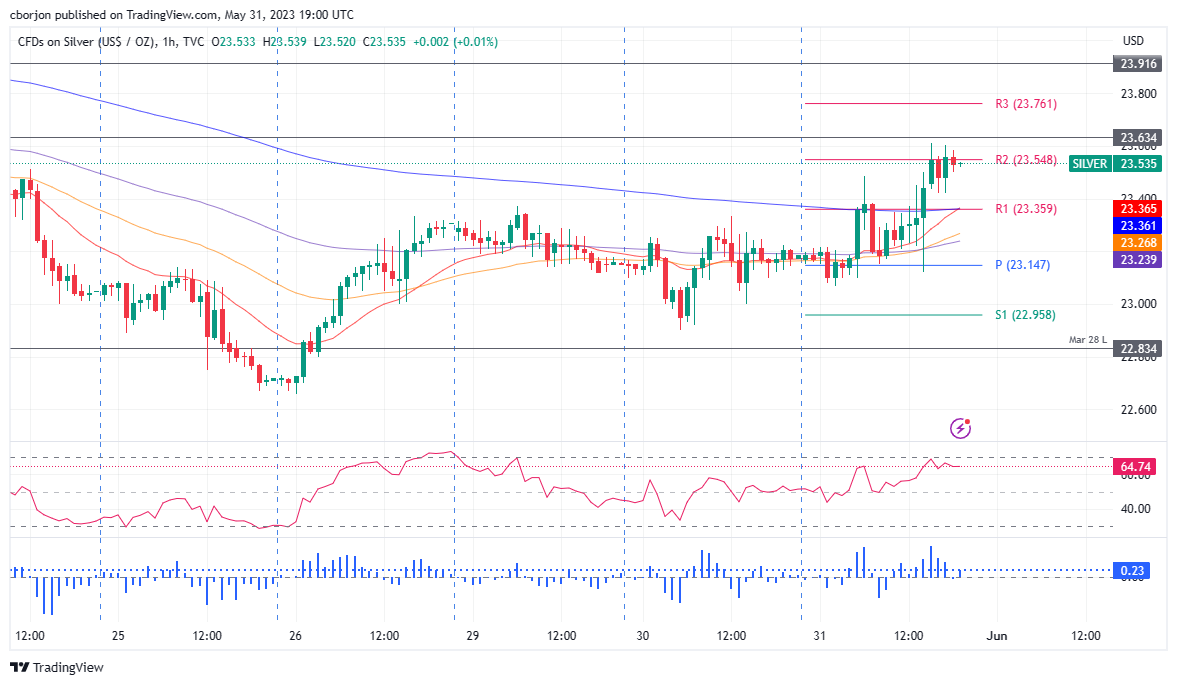
The XAG/USD hourly chart indicates the white metal is upward biased but facing solid resistance at the R2 pivot point at 23.54, with upside risks at the May 23 daily high of 23.63. A breach of the latter, XAG/USD could climb toward the May 22 high of $23.91. Conversely, the XAG/USD first support would be the R1 daily pivot at $23.36 before slumping toward the central pivot at $23.14. Once cleared, the daily low of $23.07 would be up for grabs, ahead of falling to the S1 pivot point at $22.96.
Of note, oscillators like the Relative Strength Index (RSI) indicator suggest further upside expected alongside the 3-period Rate of Change (RoC).
XAG/USD Price Action – Hourly chart


© 2000-2026. Sva prava zaštićena.
Sajt je vlasništvo kompanije Teletrade D.J. LLC 2351 LLC 2022 (Euro House, Richmond Hill Road, Kingstown, VC0100, St. Vincent and the Grenadines).
Svi podaci koji se nalaze na sajtu ne predstavljaju osnovu za donošenje investicionih odluka, već su informativnog karaktera.
The company does not serve or provide services to customers who are residents of the US, Canada, Iran, The Democratic People's Republic of Korea, Yemen and FATF blacklisted countries.
Izvršenje trgovinskih operacija sa finansijskim instrumentima upotrebom marginalne trgovine pruža velike mogućnosti i omogućava investitorima ostvarivanje visokih prihoda. Međutim, takav vid trgovine povezan je sa potencijalno visokim nivoom rizika od gubitka sredstava. Проведение торговых операций на финанcовых рынках c маржинальными финанcовыми инcтрументами открывает широкие возможноcти, и позволяет инвеcторам, готовым пойти на риcк, получать выcокую прибыль, но при этом неcет в cебе потенциально выcокий уровень риcка получения убытков. Iz tog razloga je pre započinjanja trgovine potrebno odlučiti o izboru odgovarajuće investicione strategije, uzimajući u obzir raspoložive resurse.
Upotreba informacija: U slučaju potpunog ili delimičnog preuzimanja i daljeg korišćenja materijala koji se nalazi na sajtu, potrebno je navesti link odgovarajuće stranice na sajtu kompanije TeleTrade-a kao izvora informacija. Upotreba materijala na internetu mora biti praćena hiper linkom do web stranice teletrade.org. Automatski uvoz materijala i informacija sa stranice je zabranjen.
Ako imate bilo kakvih pitanja, obratite nam se pr@teletrade.global.
транcфери