- Analiza
- Novosti i instrumenti
- Vesti sa tržišta
- Silver Price Analysis: XAG/USD eases from over a one-week high, holds above 100-day SMA
Silver Price Analysis: XAG/USD eases from over a one-week high, holds above 100-day SMA
- Silver is seen consolidating the previous day’s positive move to over a one-week high.
- The mixed technical setup warrants some caution before placing aggressive bullish bets.
- Sustained Weakness back below the $23.00 mark should pave the way for deeper losses.
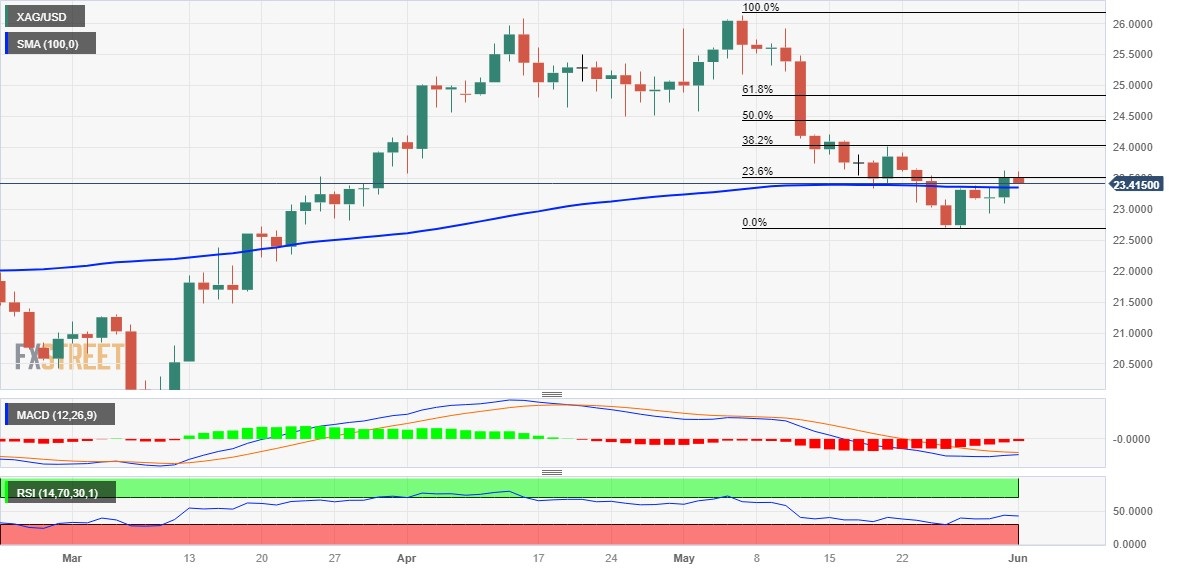
Silver struggles to capitalize on the previous day's positive move and oscillated in a narrow trading band through the early part of the European session on Thursday. The white metal is currently placed around the $23.50-$23.55 region, representing the 23.6% Fibonacci retracement level of the recent downfall from over a one-year high.
From a technical perspective, the overnight sustained strength and close above the 100-day Simple Moving Average (SMA) favours bullish traders. That said, oscillators on the daily chart - though have been recovering - are yet to confirm the positive outlook. This makes it prudent to wait for some follow-through buying beyond the $23.60 area, or over a one-week high touched on Wednesday, before positioning for any further gains.
The XAG/USD might then surpass the $24.00 mark and accelerate the momentum towards the next relevant hurdle near the $24.20-$24.25 region en route to the $24.40-$24.50 horizontal support breakpoint. The latter coincides with the 50% Fibo. level, above which a fresh bout of a short-covering should allow bullish traders to reclaim the $25.00 psychological mark. The upward trajectory could get extended towards the $25.30-$25.35 supply zone.
On the flip side, weakness back below the 100-day SMA, currently around the $23..35 area, could find some support near the $23.00 round figure. This is followed by the May monthly swing low, around the $22.70-$22.65 region, which if broken decisively will be seen as a fresh trigger for bearish traders. The XAG/USD might then turn vulnerable to weaker further towards the $22.25 intermediate support before dropping to the $22.00 round figure.
Silver daily chart
Key levels to watch


© 2000-2026. Sva prava zaštićena.
Sajt je vlasništvo kompanije Teletrade D.J. LLC 2351 LLC 2022 (Euro House, Richmond Hill Road, Kingstown, VC0100, St. Vincent and the Grenadines).
Svi podaci koji se nalaze na sajtu ne predstavljaju osnovu za donošenje investicionih odluka, već su informativnog karaktera.
The company does not serve or provide services to customers who are residents of the US, Canada, Iran, The Democratic People's Republic of Korea, Yemen and FATF blacklisted countries.
Izvršenje trgovinskih operacija sa finansijskim instrumentima upotrebom marginalne trgovine pruža velike mogućnosti i omogućava investitorima ostvarivanje visokih prihoda. Međutim, takav vid trgovine povezan je sa potencijalno visokim nivoom rizika od gubitka sredstava. Проведение торговых операций на финанcовых рынках c маржинальными финанcовыми инcтрументами открывает широкие возможноcти, и позволяет инвеcторам, готовым пойти на риcк, получать выcокую прибыль, но при этом неcет в cебе потенциально выcокий уровень риcка получения убытков. Iz tog razloga je pre započinjanja trgovine potrebno odlučiti o izboru odgovarajuće investicione strategije, uzimajući u obzir raspoložive resurse.
Upotreba informacija: U slučaju potpunog ili delimičnog preuzimanja i daljeg korišćenja materijala koji se nalazi na sajtu, potrebno je navesti link odgovarajuće stranice na sajtu kompanije TeleTrade-a kao izvora informacija. Upotreba materijala na internetu mora biti praćena hiper linkom do web stranice teletrade.org. Automatski uvoz materijala i informacija sa stranice je zabranjen.
Ako imate bilo kakvih pitanja, obratite nam se pr@teletrade.global.
транcфери