- Analiza
- Novosti i instrumenti
- Vesti sa tržišta
- Silver Price Analysis: XAG/USD reaches two-week highs, approaches the 50-day EMA
Silver Price Analysis: XAG/USD reaches two-week highs, approaches the 50-day EMA
- Silver rises over 1.50%, benefitting from Fed’s dovish stance, and US bond yields fall.
- As investors priced in a pause in Fed’s tightening cycle, the 10-year bond yield and the US Dollar tumbled.
- Technical outlook shows a sideways trend as XAG/USD battles to stay below 20 and 50-day EMAs; Support areas and potential resistance levels are highlighted.
Silver price advanced steadily by more than 1.50% on Thursday, sponsored by several reasons. Firstly, dovish remarks by Federal Reserve (Fed) officials tumbled US bond yields in the last 48 hrs. Relief of the US debt-ceiling saga, advancing to the US Senate, and weakening in manufactury activity, were the final nails in the coffin for the greenback. Therefore, the XAG/USD is exchanging hands at $23.85 after diving as low as $23.28.
The US 10-year Treasury bond yield drops four basis points (bps) from around 3.64% to 3.60%, a tailwind for the non-yielding metal. Consequently, the US Dollar Index (DXY) plummeted more than 0.50%, at 103.573, as investors began to price in Fed’s first pause after hiking 500 bps.
XAG/USD Price Analysis: Technical outlook
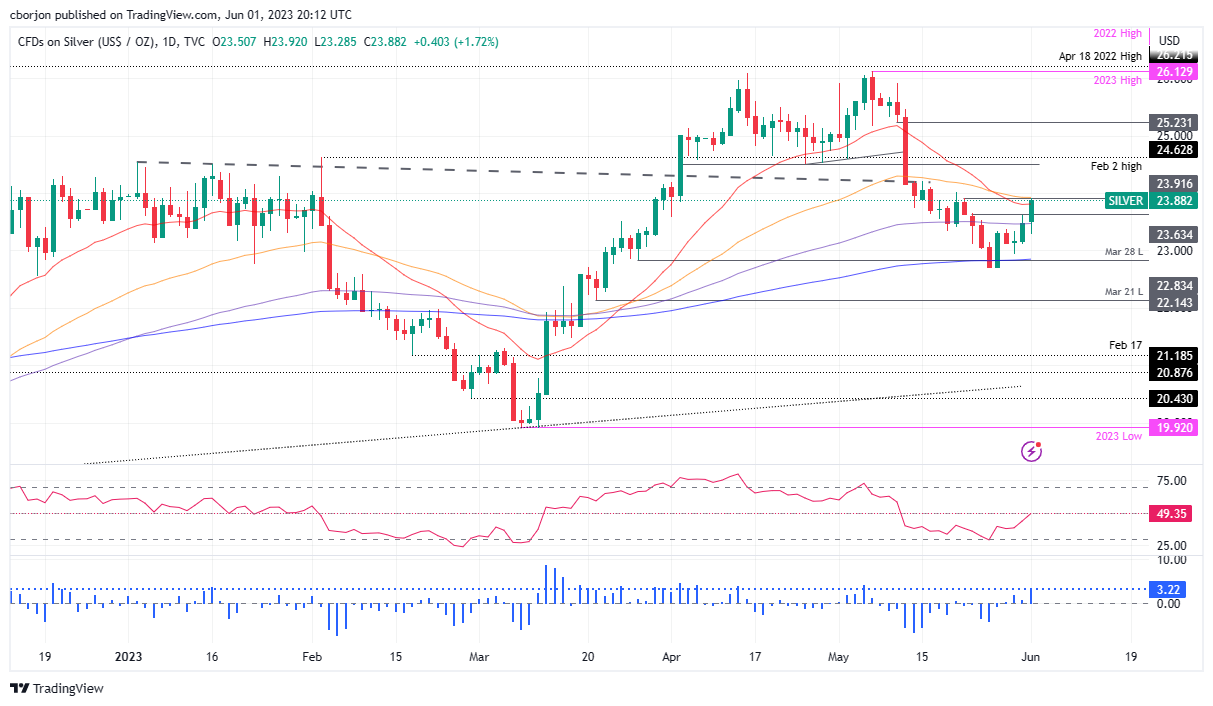
XAG/USD remains sideways after an ongoing correction lifted Silver from around two-month lows of $22.68. Even though the 200-day Exponential Moving Average (EMA) price level cushioned Silver’s fall, downside risks persist as XAG/USD battles to stay below the 20 and 50-day EMAs, at $23.80 and $23.93, respectively.
In that outcome, the following support areas would be the 100—day EMA at $23.47. A breach of the latter and XAG/USD could dive below the $23.00 figure to re-test the 200-day EMA at $22.85, briefly tested on May 25 and 26.
Conversely, XAG/USD’s first resistance would be the 50-day EMA at $23.93. Once surrendered, the $24.00 mark is up for grabs, followed by a crucial April 25 swing low test, which turned resistance at $24.49.
XAG/USD Price Action – Daily chart


© 2000-2026. Sva prava zaštićena.
Sajt je vlasništvo kompanije Teletrade D.J. LLC 2351 LLC 2022 (Euro House, Richmond Hill Road, Kingstown, VC0100, St. Vincent and the Grenadines).
Svi podaci koji se nalaze na sajtu ne predstavljaju osnovu za donošenje investicionih odluka, već su informativnog karaktera.
The company does not serve or provide services to customers who are residents of the US, Canada, Iran, The Democratic People's Republic of Korea, Yemen and FATF blacklisted countries.
Izvršenje trgovinskih operacija sa finansijskim instrumentima upotrebom marginalne trgovine pruža velike mogućnosti i omogućava investitorima ostvarivanje visokih prihoda. Međutim, takav vid trgovine povezan je sa potencijalno visokim nivoom rizika od gubitka sredstava. Проведение торговых операций на финанcовых рынках c маржинальными финанcовыми инcтрументами открывает широкие возможноcти, и позволяет инвеcторам, готовым пойти на риcк, получать выcокую прибыль, но при этом неcет в cебе потенциально выcокий уровень риcка получения убытков. Iz tog razloga je pre započinjanja trgovine potrebno odlučiti o izboru odgovarajuće investicione strategije, uzimajući u obzir raspoložive resurse.
Upotreba informacija: U slučaju potpunog ili delimičnog preuzimanja i daljeg korišćenja materijala koji se nalazi na sajtu, potrebno je navesti link odgovarajuće stranice na sajtu kompanije TeleTrade-a kao izvora informacija. Upotreba materijala na internetu mora biti praćena hiper linkom do web stranice teletrade.org. Automatski uvoz materijala i informacija sa stranice je zabranjen.
Ako imate bilo kakvih pitanja, obratite nam se pr@teletrade.global.
транcфери