- Analiza
- Novosti i instrumenti
- Vesti sa tržišta
- AUD/JPY Price Analysis: Forms a doji around 4-month high, ahead of RBA’s decision
AUD/JPY Price Analysis: Forms a doji around 4-month high, ahead of RBA’s decision
- AUD/JPY experiences a risk-off impulse amid decelerating US business activity and RBA’s monetary policy.
- Despite a lingering upward bias, market sentiment may shift due to the pair’s sensitivity to risk changes, potentially leading to violent swings.
- A balance of technical indicators suggests that AUD/JPY could target a lower range, with resistance remaining at the four-month and year-to-date highs.
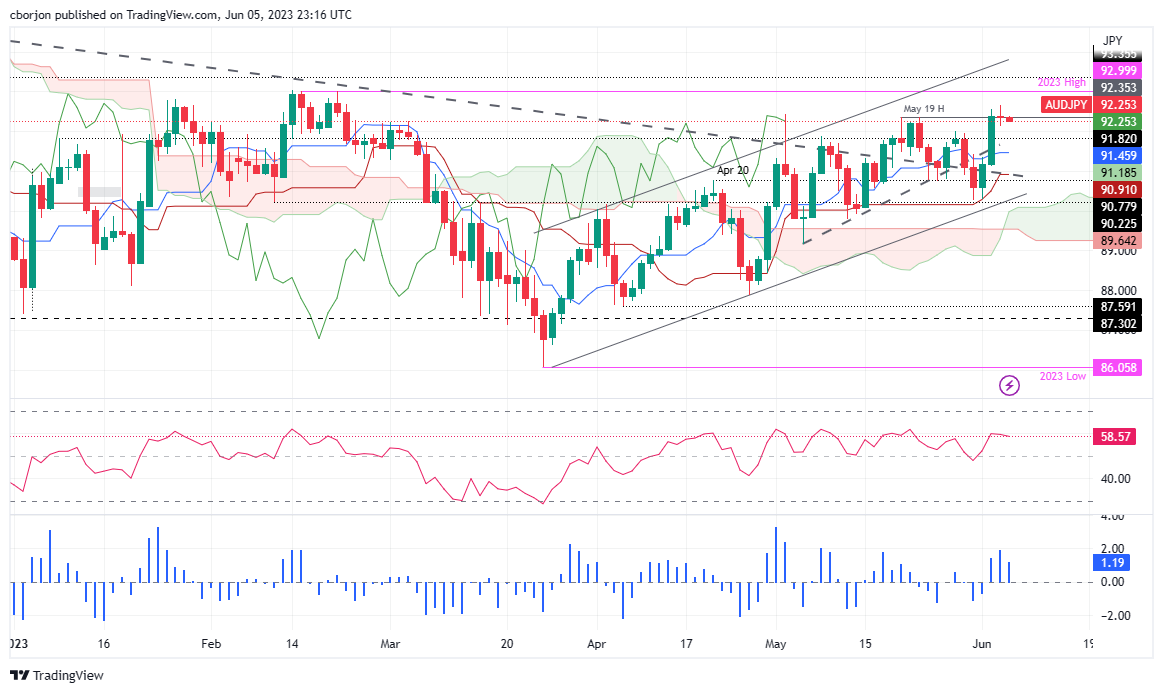
AUD/JPY forms a doji, as shown by the daily chart, after hitting a fresh four-month high at 92.66, hovering nearby the 92.30s area, after trading within the 9213/66 range on Monday. A risk-off impulse was the main reason behind price action, with US business activity decelerating, while expectations for the Reserve Bank of Australia (RBA) to keep unchanged its interest rates at the upcoming monetary policy on Tuesday pressures the Aussie (AUD).
AUD/JPY Price Analysis: Technical outlook
From a daily chart perspective, the AUD/JPY is still upward biased, but given the nature of being used as a currency pair that reflects market sentiment, a risk-off impulse could shift the bias of the AUD/JPY. As long as the AUD/JPY remains above the Ichimoku cloud, the pair is upwards, but the Chikou Span, piercing May 2 candlestick chart at around 92.25, could trigger a sell signal, which could lower the price.
The Relative Strength Index (RSI) indicator is still bullish, but the three days Rate of Change (RoC) portrays that buying pressure is easing. Therefore, the AUD/JPY could aim toward the Tenkan-Sen Line at 91.46, as an initial target, in the near term, followed by the confluence of a support trendline and the Kijun Sen at 90.91.
Conversely, the AUD/JPY first resistance would be the four-month high at 92.66 before testing the YTD high at 92.99. A breach of the latter will expose the last year’s YTD high of 98.59.
AUD/JPY Price Action – Daily chart


© 2000-2026. Sva prava zaštićena.
Sajt je vlasništvo kompanije Teletrade D.J. LLC 2351 LLC 2022 (Euro House, Richmond Hill Road, Kingstown, VC0100, St. Vincent and the Grenadines).
Svi podaci koji se nalaze na sajtu ne predstavljaju osnovu za donošenje investicionih odluka, već su informativnog karaktera.
The company does not serve or provide services to customers who are residents of the US, Canada, Iran, The Democratic People's Republic of Korea, Yemen and FATF blacklisted countries.
Izvršenje trgovinskih operacija sa finansijskim instrumentima upotrebom marginalne trgovine pruža velike mogućnosti i omogućava investitorima ostvarivanje visokih prihoda. Međutim, takav vid trgovine povezan je sa potencijalno visokim nivoom rizika od gubitka sredstava. Проведение торговых операций на финанcовых рынках c маржинальными финанcовыми инcтрументами открывает широкие возможноcти, и позволяет инвеcторам, готовым пойти на риcк, получать выcокую прибыль, но при этом неcет в cебе потенциально выcокий уровень риcка получения убытков. Iz tog razloga je pre započinjanja trgovine potrebno odlučiti o izboru odgovarajuće investicione strategije, uzimajući u obzir raspoložive resurse.
Upotreba informacija: U slučaju potpunog ili delimičnog preuzimanja i daljeg korišćenja materijala koji se nalazi na sajtu, potrebno je navesti link odgovarajuće stranice na sajtu kompanije TeleTrade-a kao izvora informacija. Upotreba materijala na internetu mora biti praćena hiper linkom do web stranice teletrade.org. Automatski uvoz materijala i informacija sa stranice je zabranjen.
Ako imate bilo kakvih pitanja, obratite nam se pr@teletrade.global.
транcфери