- Analiza
- Novosti i instrumenti
- Vesti sa tržišta
- USD/JPY Price Analysis: Looks vulnerable above 139.00
USD/JPY Price Analysis: Looks vulnerable above 139.00
- USD/JPY seems vulnerable above 139.00 as the USD Index is losing its charm.
- BoJ Ueda said the central bank will discuss specifics of an exit policy when achievement of the price target is foreseen.
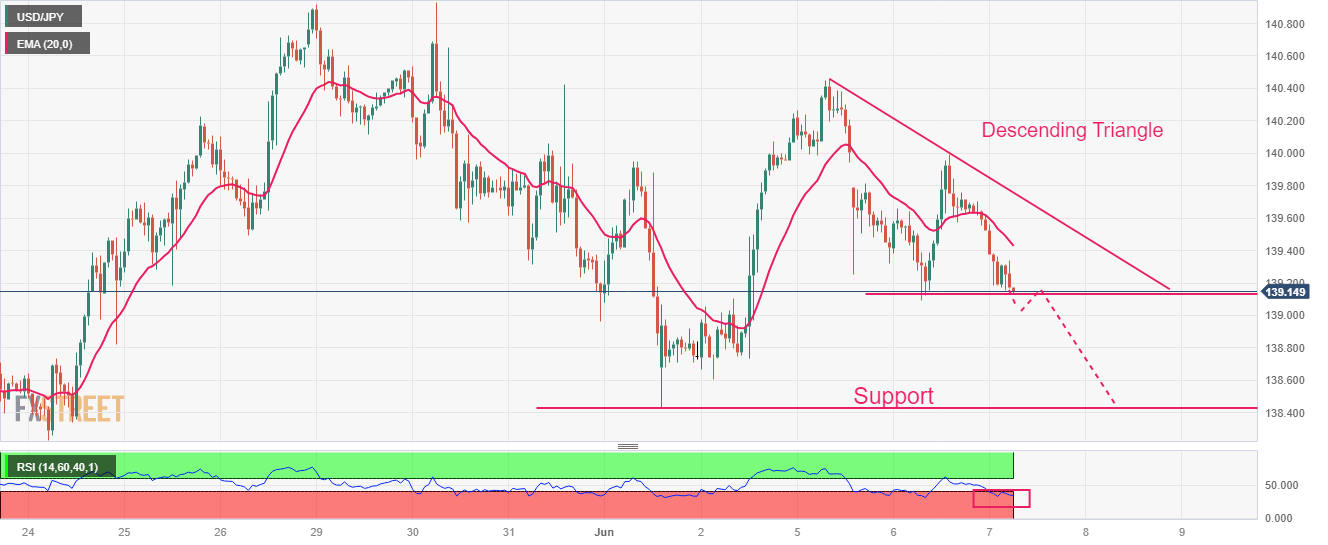
- USD/JPY is expected to display a sheer downside after a breakdown of the Descending Triangle pattern.
The USD/JPY pair is juggling in a narrow range above the crucial support of 139.00 in the Asian session. The asset seems vulnerable above the aforementioned support as the US Dollar Index is losing its charm. Where major central banks are gearing up for a fresh interest rate hike, investors are anticipating that the Federal Reserve (Fed) could pause its policy-tightening spell as the impact of interest rate hikes yet made has not passed.
The US Dollar Index (DXY) has witnessed some support after correcting to near 104.00. A squeeze in volatility for the USD Index is anticipated amid an absence of potential economic events this week.
Meanwhile, the Japanese yen has got some strength as Bank of Japan (BoJ) Governor Kazuo Ueda said on Wednesday, “When achievement of price target is foreseen, we will discuss specifics of an exit policy and disclose information as needed.”
USD/JPY is on the verge of delivering a breakdown of the Descending Triangle chart pattern formed on an hourly scale. A breakdown of the aforementioned pattern results in wider ticks and heavy volume.
Declining 20-period Exponential Moving Average (EMA) at 139.43 adds to the downside filters.
The Relative Strength Index (RSI) (14) has shifted into the bearish range of 20.00-40.00, which indicates that downside momentum has been triggered.
A confident break below June 06 low at 139.09 will drag the asset toward March 08 high at 137.92 followed by March 02 high at 137.10
On the flip side, a break above May 31 high at 140.42 will drive the asset toward May 30 high at 140.93. A break above the latter will expose the asset to a fresh six-month high of around 141.61, which is 23 November 2022 high.
USD/JPY hourly chart


© 2000-2026. Sva prava zaštićena.
Sajt je vlasništvo kompanije Teletrade D.J. LLC 2351 LLC 2022 (Euro House, Richmond Hill Road, Kingstown, VC0100, St. Vincent and the Grenadines).
Svi podaci koji se nalaze na sajtu ne predstavljaju osnovu za donošenje investicionih odluka, već su informativnog karaktera.
The company does not serve or provide services to customers who are residents of the US, Canada, Iran, The Democratic People's Republic of Korea, Yemen and FATF blacklisted countries.
Izvršenje trgovinskih operacija sa finansijskim instrumentima upotrebom marginalne trgovine pruža velike mogućnosti i omogućava investitorima ostvarivanje visokih prihoda. Međutim, takav vid trgovine povezan je sa potencijalno visokim nivoom rizika od gubitka sredstava. Проведение торговых операций на финанcовых рынках c маржинальными финанcовыми инcтрументами открывает широкие возможноcти, и позволяет инвеcторам, готовым пойти на риcк, получать выcокую прибыль, но при этом неcет в cебе потенциально выcокий уровень риcка получения убытков. Iz tog razloga je pre započinjanja trgovine potrebno odlučiti o izboru odgovarajuće investicione strategije, uzimajući u obzir raspoložive resurse.
Upotreba informacija: U slučaju potpunog ili delimičnog preuzimanja i daljeg korišćenja materijala koji se nalazi na sajtu, potrebno je navesti link odgovarajuće stranice na sajtu kompanije TeleTrade-a kao izvora informacija. Upotreba materijala na internetu mora biti praćena hiper linkom do web stranice teletrade.org. Automatski uvoz materijala i informacija sa stranice je zabranjen.
Ako imate bilo kakvih pitanja, obratite nam se pr@teletrade.global.
транcфери