- Analiza
- Novosti i instrumenti
- Vesti sa tržišta
- USD/INR Price Analysis: Lacks any firm direction, stuck in a range around 100-day SMA
USD/INR Price Analysis: Lacks any firm direction, stuck in a range around 100-day SMA
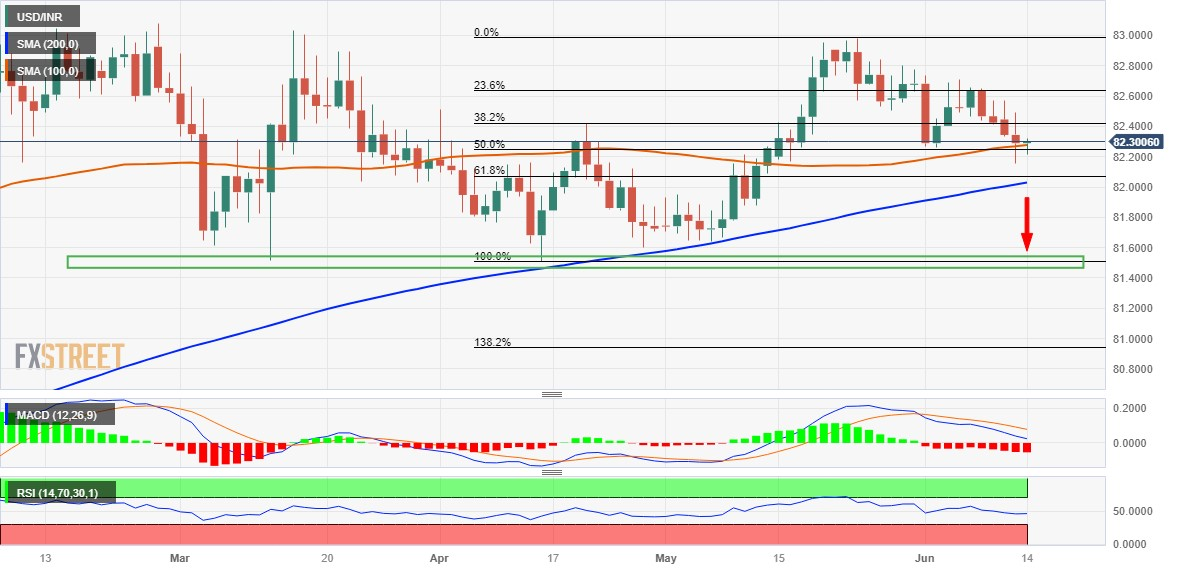
- USD/INR oscillates in a narrow trading band through the Asian session on Wednesday.
- Failure to find acceptance below the 100-day SMA warrants caution for bearish traders.
- A break below the 82.00 confluence is needed to support prospects for additional losses.
The USD/INR pair struggles to gain any meaningful traction on Wednesday and seesaws between tepid gains/minor losses through the Asian session. The pair currently trades around the 82.25-82.30 region, nearly unchanged for the day, and remains well within the striking distance of its lowest level since May 16 touched on Tuesday.
From a technical perspective, the USD/INR pair, so far, has been showing some resilience below the 100-day Simple Moving Average (SMA) and the 38.2% Fibonacci retracement level of the April-May rally. This makes it prudent to wait for some follow-through selling below the overnight swing low, around the 82.15 area, before placing fresh bearish bets. This is closely followed by the 82.00 confluence, comprising the very important 200-day SMA and the 61.8% Fibo. level.
A convincing break below the latter will mark a fresh breakdown and set the stage for an extension of the recent pullback from the vicinity of the 83.00 round figure. With oscillators on the daily chart just starting to gain negative traction, the USD/INR pair might then accelerate the downfall towards the 81.75 intermediate support en route to the March/April swing low, around 81.50 strong horizontal support.
On the flip side, the 38.2% Fibo. level, around the 82.40 region, now seems to act as an immediate hurdle. The next relevant resistance is pegged near the 82.60-82.65 zone, or the 23.6% Fibo. level, which if cleared might trigger a short-covering move. The USD/INR pair might then make a fresh attempt to conquer the 83.00 round-figure mark. Bulls might eventually aim to challenge the all-time high, around the 83.40-83.45 area touched in October 2022.
USD/INR daily chart
Key levels to watch


© 2000-2026. Sva prava zaštićena.
Sajt je vlasništvo kompanije Teletrade D.J. LLC 2351 LLC 2022 (Euro House, Richmond Hill Road, Kingstown, VC0100, St. Vincent and the Grenadines).
Svi podaci koji se nalaze na sajtu ne predstavljaju osnovu za donošenje investicionih odluka, već su informativnog karaktera.
The company does not serve or provide services to customers who are residents of the US, Canada, Iran, The Democratic People's Republic of Korea, Yemen and FATF blacklisted countries.
Izvršenje trgovinskih operacija sa finansijskim instrumentima upotrebom marginalne trgovine pruža velike mogućnosti i omogućava investitorima ostvarivanje visokih prihoda. Međutim, takav vid trgovine povezan je sa potencijalno visokim nivoom rizika od gubitka sredstava. Проведение торговых операций на финанcовых рынках c маржинальными финанcовыми инcтрументами открывает широкие возможноcти, и позволяет инвеcторам, готовым пойти на риcк, получать выcокую прибыль, но при этом неcет в cебе потенциально выcокий уровень риcка получения убытков. Iz tog razloga je pre započinjanja trgovine potrebno odlučiti o izboru odgovarajuće investicione strategije, uzimajući u obzir raspoložive resurse.
Upotreba informacija: U slučaju potpunog ili delimičnog preuzimanja i daljeg korišćenja materijala koji se nalazi na sajtu, potrebno je navesti link odgovarajuće stranice na sajtu kompanije TeleTrade-a kao izvora informacija. Upotreba materijala na internetu mora biti praćena hiper linkom do web stranice teletrade.org. Automatski uvoz materijala i informacija sa stranice je zabranjen.
Ako imate bilo kakvih pitanja, obratite nam se pr@teletrade.global.
транcфери