- Analiza
- Novosti i instrumenti
- Vesti sa tržišta
- Gold Price Analysis: XAU/USD bears wiped the floor with the bulls, but will they emerge again?
Gold Price Analysis: XAU/USD bears wiped the floor with the bulls, but will they emerge again?
- Gold bears moved in for the kill and swept up the bulls and stake stops.
- The market's focus will now turn to Fed chairman Jerome Powell.
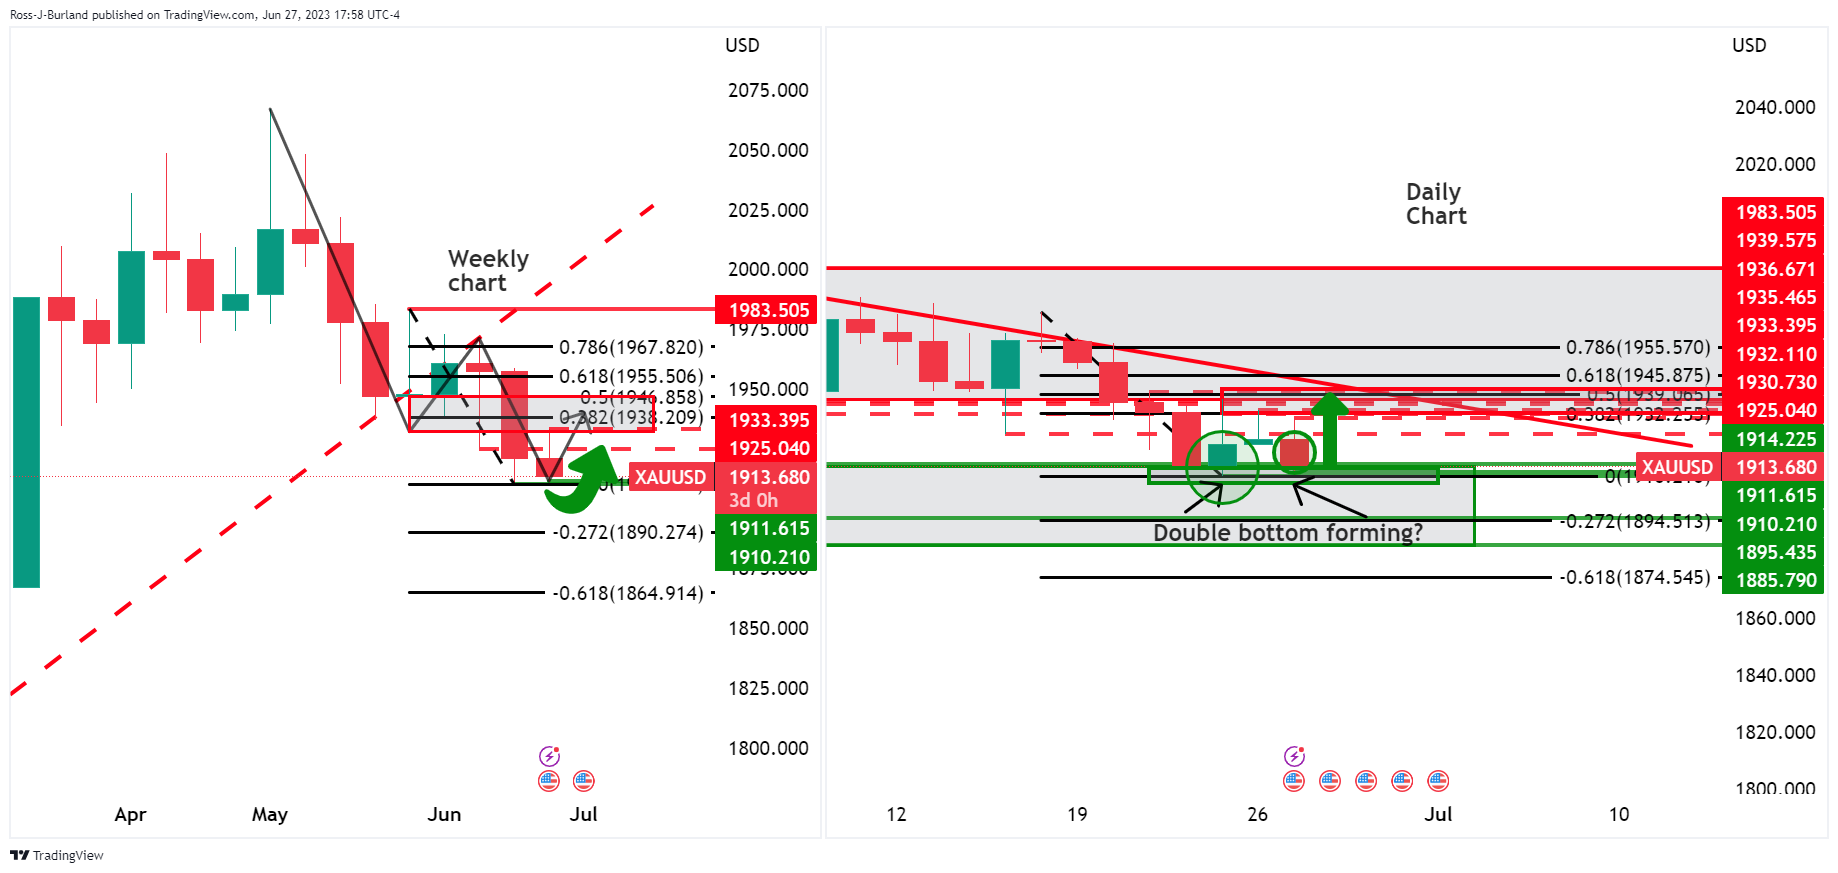
Gold price dropped on Tuesdays to complete the week's opening balance between $1,933 and $1,910 round numbers. The yellow metal fell from a high of $1,930.73 to a low of $1,910.89. Essentially, the market went after the money on the downside following a narrow inside day on Monday ahead of key events for the days ahead.
US-manufactured capital goods today unexpectedly rose in May, but the prior month's data was revised down. On the Russian front, risks from the short-lived mutiny in the nation appear to have been digested and on the back burner. Meanwhile, traders are looking ahead to Federal Reserve Chair Jerome Powell's speech along with a trove of key economic data on Thursday that could offer clues on future interest rate hikes.
However, analysts at TD Securities say that they expect that this Friday's Personal Consumption Expenditure report won't corroborate the rates markets pricing of 17bp of hikes in July, particularly as the core PCE services ex-housing measure is likely to post its smallest increase since last July. ''Nonetheless, algos are unlikely to fuel additional upside until prices break above the $2,010/oz mark, suggesting that gold bulls may need discretionary traders to lose faith in the Fed's hawkish tone for prices to resume their upward trajectory.''
Gold technical analysis
Technically, the US Dollar is under pressure on the weekly and daily charts and this could be the fuel for the Gold bugs. On the Gold weekly chart, we have seen a downside extension that could have made a low and thus, the focus is on the upside. a 38.2% Fibonacci retracement of the latest downside impulse's range on the weekly chart marries up with a 50% mean reversion area on the daily chart into trendline resistance around $1,938/39. If the USD continues to deteriorate, this could lead to a double bottom on Gold's daily chart.


© 2000-2026. Sva prava zaštićena.
Sajt je vlasništvo kompanije Teletrade D.J. LLC 2351 LLC 2022 (Euro House, Richmond Hill Road, Kingstown, VC0100, St. Vincent and the Grenadines).
Svi podaci koji se nalaze na sajtu ne predstavljaju osnovu za donošenje investicionih odluka, već su informativnog karaktera.
The company does not serve or provide services to customers who are residents of the US, Canada, Iran, The Democratic People's Republic of Korea, Yemen and FATF blacklisted countries.
Izvršenje trgovinskih operacija sa finansijskim instrumentima upotrebom marginalne trgovine pruža velike mogućnosti i omogućava investitorima ostvarivanje visokih prihoda. Međutim, takav vid trgovine povezan je sa potencijalno visokim nivoom rizika od gubitka sredstava. Проведение торговых операций на финанcовых рынках c маржинальными финанcовыми инcтрументами открывает широкие возможноcти, и позволяет инвеcторам, готовым пойти на риcк, получать выcокую прибыль, но при этом неcет в cебе потенциально выcокий уровень риcка получения убытков. Iz tog razloga je pre započinjanja trgovine potrebno odlučiti o izboru odgovarajuće investicione strategije, uzimajući u obzir raspoložive resurse.
Upotreba informacija: U slučaju potpunog ili delimičnog preuzimanja i daljeg korišćenja materijala koji se nalazi na sajtu, potrebno je navesti link odgovarajuće stranice na sajtu kompanije TeleTrade-a kao izvora informacija. Upotreba materijala na internetu mora biti praćena hiper linkom do web stranice teletrade.org. Automatski uvoz materijala i informacija sa stranice je zabranjen.
Ako imate bilo kakvih pitanja, obratite nam se pr@teletrade.global.
транcфери