- Analiza
- Novosti i instrumenti
- Vesti sa tržišta
- GBP/JPY Price Analysis: Could negative divergence between RSI and price action trigger a correction?
GBP/JPY Price Analysis: Could negative divergence between RSI and price action trigger a correction?
- GBP/JPY struggles to break the 184.00 mark amid potential Japanese FX intervention, ending Tuesday with near flatline movement.
- Negative divergence in RSI suggests a potential for a pullback, with the Tenkan-Sen line inching closer to price action.
- Key levels to watch include resistance at 186.34 and several support levels leading down to the Kijun-Sen line at 178.21.
GBP/JPY consolidates at around the 183.60s area after hitting a year-to-date (YTD) high of 183.90, shy of hitting the 184.00 mark. On Tuesday, the GBP/JPY finished the session around 183.59, nearby its open price, forming a doji. That said, GBP/JPY is set to trade sideways unless a catalyst spurs a break to eigh-year highs or a correction gets underway. As the Asian session commences, the GBP/JPY trades at 153.65, almost flat.
GBP/JPY Price Analysis: Technical outlook
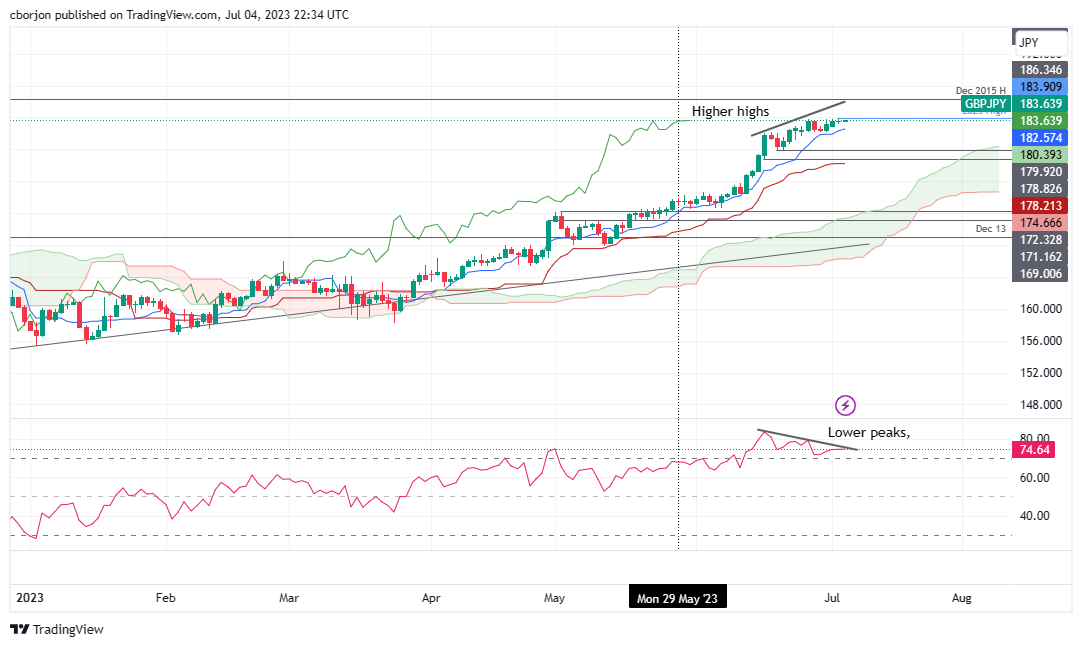
The GBP/JPY remains upward biased, though of late, the pair has struggled to get to new YTD highs, as threats of Japan’s government intervention in the FX markets keep traders on their toes. The Relative Strength Index (RSI) indicator remains at overbought levels, printing lower peaks, while the GBP/JPY registers higher highs. That means a negative divergence surfaced, which could pave the way for a pullback.
Additionally, the Tenkan-Sen line is getting close to price action, opening the door for a fall below the latte, which could spur a GBP/JPY sell signal, opening the door for a pullback toward the Senkou Span A line at 180.39 before slumping toward the June 20 daily low of 179.92. Break below will expose a test of the June 16 low of 178.82, slightly above the Kijun-Sen line at 178.21.
Conversely, if the GBP/JPY cracks the 184.00 mark, the first resistance appears at December’s 2015 high of 186.34, followed by the 190.00 figure.
GBP/JPY Price Action – Daily chart


© 2000-2026. Sva prava zaštićena.
Sajt je vlasništvo kompanije Teletrade D.J. LLC 2351 LLC 2022 (Euro House, Richmond Hill Road, Kingstown, VC0100, St. Vincent and the Grenadines).
Svi podaci koji se nalaze na sajtu ne predstavljaju osnovu za donošenje investicionih odluka, već su informativnog karaktera.
The company does not serve or provide services to customers who are residents of the US, Canada, Iran, The Democratic People's Republic of Korea, Yemen and FATF blacklisted countries.
Izvršenje trgovinskih operacija sa finansijskim instrumentima upotrebom marginalne trgovine pruža velike mogućnosti i omogućava investitorima ostvarivanje visokih prihoda. Međutim, takav vid trgovine povezan je sa potencijalno visokim nivoom rizika od gubitka sredstava. Проведение торговых операций на финанcовых рынках c маржинальными финанcовыми инcтрументами открывает широкие возможноcти, и позволяет инвеcторам, готовым пойти на риcк, получать выcокую прибыль, но при этом неcет в cебе потенциально выcокий уровень риcка получения убытков. Iz tog razloga je pre započinjanja trgovine potrebno odlučiti o izboru odgovarajuće investicione strategije, uzimajući u obzir raspoložive resurse.
Upotreba informacija: U slučaju potpunog ili delimičnog preuzimanja i daljeg korišćenja materijala koji se nalazi na sajtu, potrebno je navesti link odgovarajuće stranice na sajtu kompanije TeleTrade-a kao izvora informacija. Upotreba materijala na internetu mora biti praćena hiper linkom do web stranice teletrade.org. Automatski uvoz materijala i informacija sa stranice je zabranjen.
Ako imate bilo kakvih pitanja, obratite nam se pr@teletrade.global.
транcфери