- Analiza
- Novosti i instrumenti
- Vesti sa tržišta
- USD/MXN Price Analysis: Hangs near multi-year low, bears retain control below 17.0000 mark
USD/MXN Price Analysis: Hangs near multi-year low, bears retain control below 17.0000 mark
- USD/MXN consolidates in a range below the 17.0000 mark through the Asian session on Thursday.
- The formation of the descending channel and the recent price action still favours bearish traders.
- The RSI on the daily chart is on the verge of breaking into the oversold zone and warrants caution.
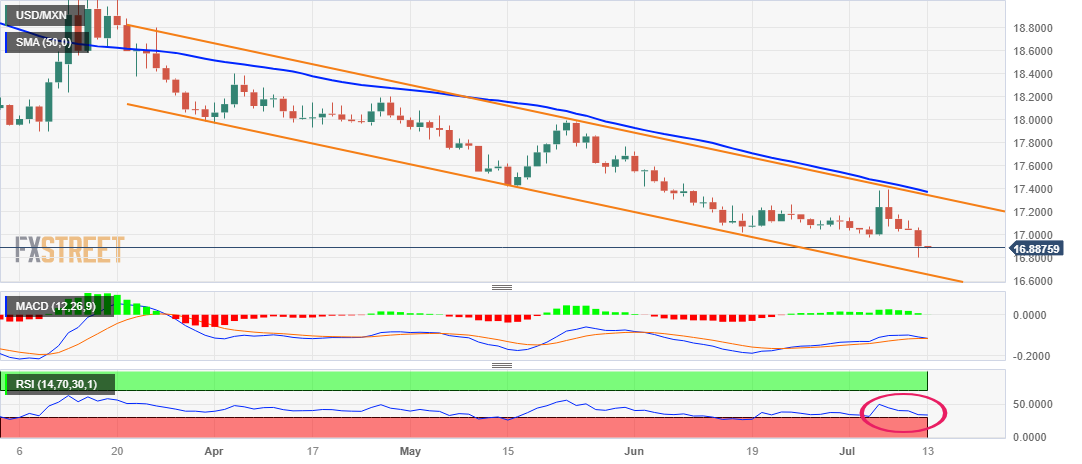
The USD/MXN pair struggles to capitalize on the previous day's modest bounce from the 16.8085 region, or its lowest level since December 2015 and oscillates in a narrow trading band through the Asian session on Thursday. Spot prices, meanwhile, now seem to have found acceptance below the 17.0000 mark and remain vulnerable to depreciate further.
The decline witnessed over the past three months or so has been along a downward-sloping channel, which points to a well-established short-term bearish trend. Furthermore, the recent failure near the trend-channel resistance, which coincides with the 50-day Simple Moving Average (SMA), and the subsequent slide validates the negative outlook for the USD/MXN pair. That said, the Relative Strength Index (RSI) on the daily chart has moved on the verge of breaking into the oversold zone and warrants some caution.
Hence, any further decline below the overnight swing low is more likely to find support near the lower end of the aforementioned channel, currently pegged around the 16.6750 area. A convincing breakdown below, however, will be seen as a fresh trigger for bearish traders and set the stage for an extension of a one-year-old downtrend.
On the flip side, any meaningful recovery now seems to confront stiff resistance near the 17.0000 horizontal support breakpoint. This is followed by the 17.0500 hurdle, which if cleared decisively might trigger a short-covering rally and lift the USD/MXN pair towards the 17.1200 intermediate barrier. The momentum could get extended further towards the next relevant resistance near the 17.1790-17.1800 region en route to the 17.2420-17.2430 supply zone.
USD/MXN daily chart
Key levels to watch


© 2000-2026. Sva prava zaštićena.
Sajt je vlasništvo kompanije Teletrade D.J. LLC 2351 LLC 2022 (Euro House, Richmond Hill Road, Kingstown, VC0100, St. Vincent and the Grenadines).
Svi podaci koji se nalaze na sajtu ne predstavljaju osnovu za donošenje investicionih odluka, već su informativnog karaktera.
The company does not serve or provide services to customers who are residents of the US, Canada, Iran, The Democratic People's Republic of Korea, Yemen and FATF blacklisted countries.
Izvršenje trgovinskih operacija sa finansijskim instrumentima upotrebom marginalne trgovine pruža velike mogućnosti i omogućava investitorima ostvarivanje visokih prihoda. Međutim, takav vid trgovine povezan je sa potencijalno visokim nivoom rizika od gubitka sredstava. Проведение торговых операций на финанcовых рынках c маржинальными финанcовыми инcтрументами открывает широкие возможноcти, и позволяет инвеcторам, готовым пойти на риcк, получать выcокую прибыль, но при этом неcет в cебе потенциально выcокий уровень риcка получения убытков. Iz tog razloga je pre započinjanja trgovine potrebno odlučiti o izboru odgovarajuće investicione strategije, uzimajući u obzir raspoložive resurse.
Upotreba informacija: U slučaju potpunog ili delimičnog preuzimanja i daljeg korišćenja materijala koji se nalazi na sajtu, potrebno je navesti link odgovarajuće stranice na sajtu kompanije TeleTrade-a kao izvora informacija. Upotreba materijala na internetu mora biti praćena hiper linkom do web stranice teletrade.org. Automatski uvoz materijala i informacija sa stranice je zabranjen.
Ako imate bilo kakvih pitanja, obratite nam se pr@teletrade.global.
транcфери