- Analiza
- Novosti i instrumenti
- Vesti sa tržišta
- WTI Price Analysis: WTI trades below $75.00 on choppy session
WTI Price Analysis: WTI trades below $75.00 on choppy session
- WTI sets its second day in a row of losses as investors continue to take profits following a three-week gain streak.
- Unexpected supply disruptions in Nigeria and Lybia may limit the downside’s potential.
- Eyes on Tuesday’s Retail Sales data from the US.
At the start of the week, the West Texas Intermediate (WTI) barrel fell below $75.00. The downside movements may be explained by investors taking profits and a slight recovery of the US Dollar.
The focus is set on Tuesday’s Retail Sales data from the US from June. As the USD significantly weakened following soft inflation figures from June which fueled dovish bets on the Federal Reserve (Fed), weak Retail Sales figure could fire another downwards leg for the Greenback. As for now, markets are expecting the headline figure to have increased 0.5% MoM in June while the sales excluding the Automobile sectors to have expanded 0.3% MoM.
Meanwhile, according to the CME FedWatch Tool, investors have largely priced in a 25 basis points (bps) hike in the next July 26 meeting of the Fed but the odds of another hike in 2023 have dropped to nearly 20%. In that sense, as higher interest rates tend to be negatively correlated with Oil prices, the WTI could regain momentum if markets continue to bet on a dovish Fed.
WTI Levels to watch
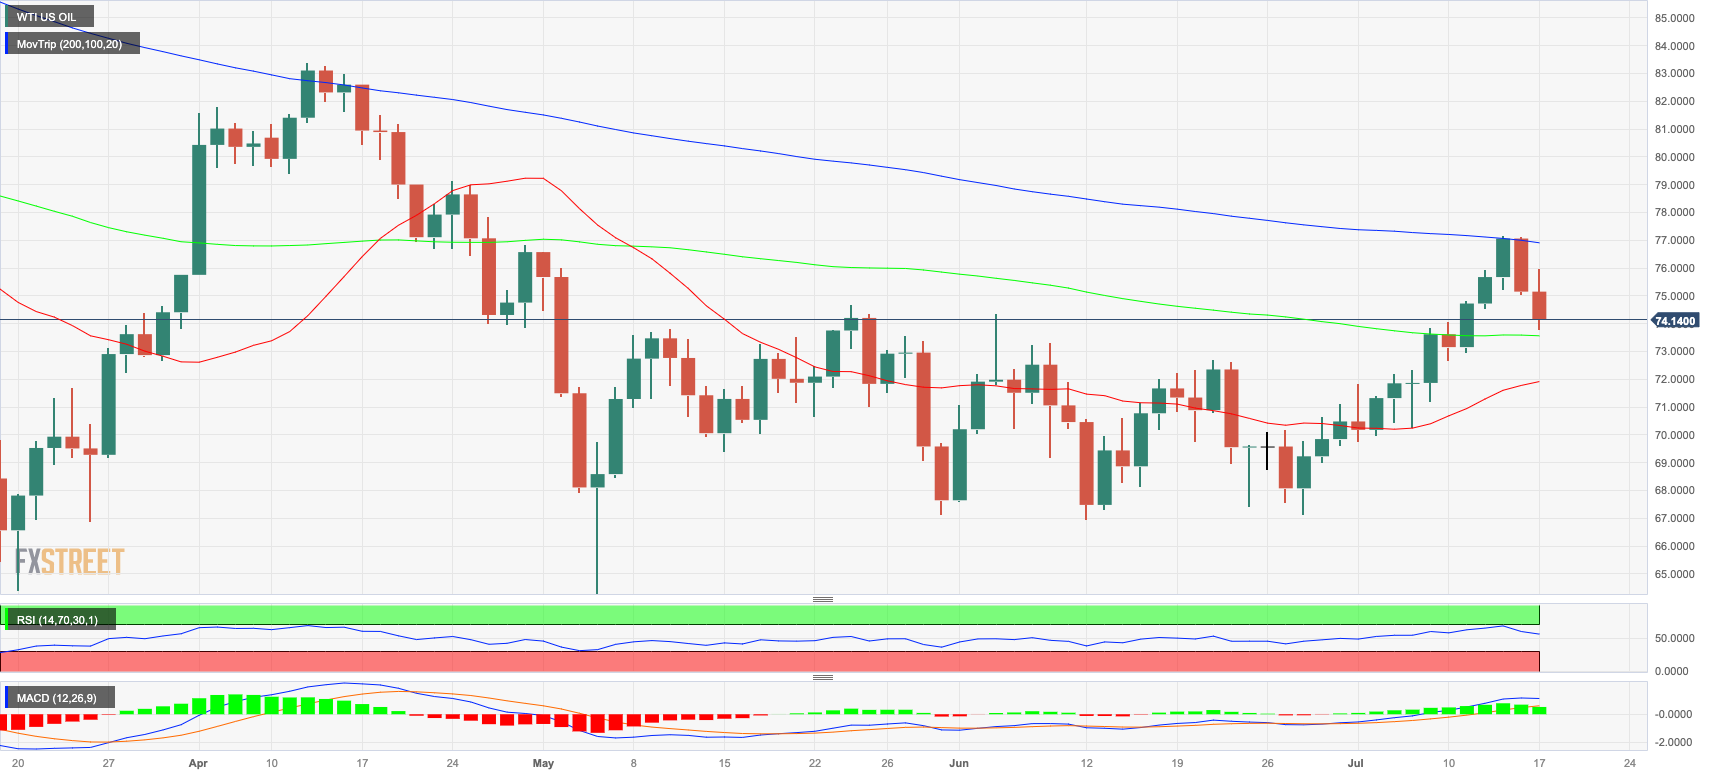
The daily chart suggest that the technical outlook is neutral to bearish for the short term. The Relative Strength Index (RSI) displays a negative slope but stands above its midline while the Moving Average Convergence Divergence (MACD) print lower green bars, indicating the the bullish momentum is slowly fading out. That being said, the price trading above the 100 and 20-day Simple Moving Averages (SMAs) suggests that on the bigger picture, the outlook favours the bulls.
Support Levels: $73.55 (100-day SMA), $72.80, $71.90 (20-day SMA).
Resistance Levels:$76.00, $77.00,$77.30 (200-day SMA).
WTI Daily chart


© 2000-2026. Sva prava zaštićena.
Sajt je vlasništvo kompanije Teletrade D.J. LLC 2351 LLC 2022 (Euro House, Richmond Hill Road, Kingstown, VC0100, St. Vincent and the Grenadines).
Svi podaci koji se nalaze na sajtu ne predstavljaju osnovu za donošenje investicionih odluka, već su informativnog karaktera.
The company does not serve or provide services to customers who are residents of the US, Canada, Iran, The Democratic People's Republic of Korea, Yemen and FATF blacklisted countries.
Izvršenje trgovinskih operacija sa finansijskim instrumentima upotrebom marginalne trgovine pruža velike mogućnosti i omogućava investitorima ostvarivanje visokih prihoda. Međutim, takav vid trgovine povezan je sa potencijalno visokim nivoom rizika od gubitka sredstava. Проведение торговых операций на финанcовых рынках c маржинальными финанcовыми инcтрументами открывает широкие возможноcти, и позволяет инвеcторам, готовым пойти на риcк, получать выcокую прибыль, но при этом неcет в cебе потенциально выcокий уровень риcка получения убытков. Iz tog razloga je pre započinjanja trgovine potrebno odlučiti o izboru odgovarajuće investicione strategije, uzimajući u obzir raspoložive resurse.
Upotreba informacija: U slučaju potpunog ili delimičnog preuzimanja i daljeg korišćenja materijala koji se nalazi na sajtu, potrebno je navesti link odgovarajuće stranice na sajtu kompanije TeleTrade-a kao izvora informacija. Upotreba materijala na internetu mora biti praćena hiper linkom do web stranice teletrade.org. Automatski uvoz materijala i informacija sa stranice je zabranjen.
Ako imate bilo kakvih pitanja, obratite nam se pr@teletrade.global.
транcфери