- Analiza
- Novosti i instrumenti
- Vesti sa tržišta
- Natural Gas Price Analysis: XNG/USD clings to mild gains near $2.73, multi-month-old resistance line eyed
Natural Gas Price Analysis: XNG/USD clings to mild gains near $2.73, multi-month-old resistance line eyed
- Natural Gas Price remains on the front foot after refreshing two-week high.
- Clear upside break of three-week-old descending trend line, 61.8% Fibonacci retracement favors XNG/USD bulls.
- Bulls remain hopeful beyond a convergence of 100-SMA, 38.2% Fibonacci retracement.
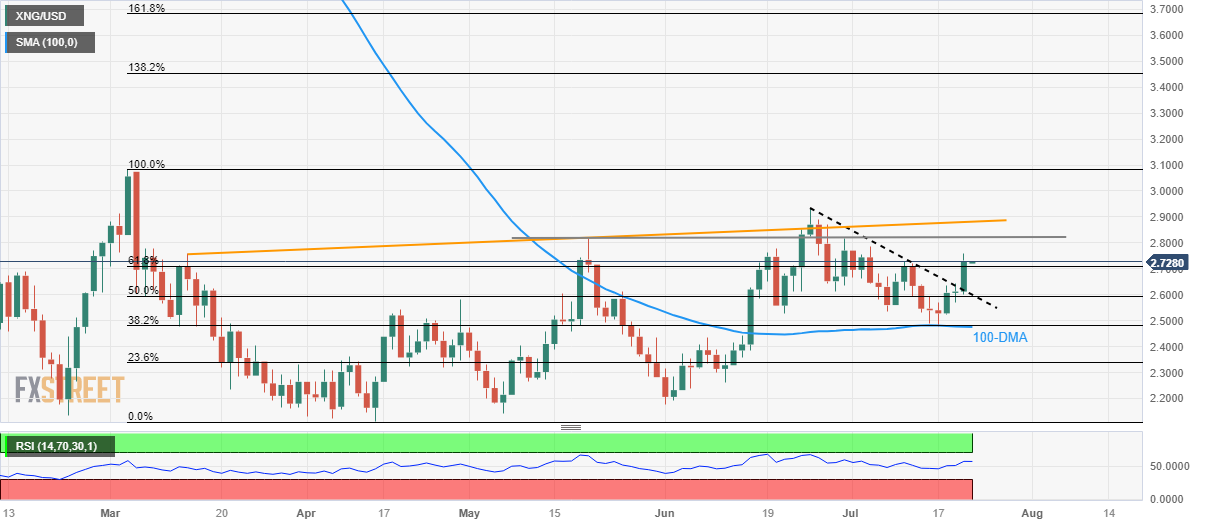
Natural Gas Price (XNG/USD) edges higher past $2.72, staying firmer at the two-week high during the early hours of Friday’s Asian session. In doing so, the energy instrument clings to mild gains after rising the most in a month the previous day.
That said, a daily closing beyond the 61.8% Fibonacci retracement of the XNG/USD’s March-April downside, near $2.71, joins the upbeat RSI (14) line to keep the buyers hopeful.
Adding strength to the bullish bias is the commodity’s sustained U-turn from 100-DMA and a break of the previous resistance line stretched from June 26.
With this, the Natural Gas Price is expected to stretch the latest run-up towards the horizontal hurdle around $2.81 comprising the tops marked in May and late June.
Following that, an upward-sloping resistance line from March, close to $2.88, will be in the spotlight.
It’s worth noting that the RSI (14) may reach the overbought territory should the Natural Gas Price rise past $2.88, which in turn challenge the quote’s further upside then.
In a case where the XNG/USD remains firmer past $2.88, the tops marked in June and March, respectively near $2.93 and $3.08, may challenge the buyers before directing them to the yearly top.
On the contrary, the 61.8% Fibonacci retracement level of $2.71 acts as immediate support for the Natural Gas Price.
Following that, the previous resistance line and 50% Fibonacci retracement can challenge the XNG/USD bears around $2.60.
Above all, the Natural Gas buyers remain hopeful unless witnessing a daily closing beneath the 100-DMA and 38.2% Fibonacci retracement, close to $2.47 at the latest.
Natural Gas Price: Daily chart
Trend: Further upside expected


© 2000-2026. Sva prava zaštićena.
Sajt je vlasništvo kompanije Teletrade D.J. LLC 2351 LLC 2022 (Euro House, Richmond Hill Road, Kingstown, VC0100, St. Vincent and the Grenadines).
Svi podaci koji se nalaze na sajtu ne predstavljaju osnovu za donošenje investicionih odluka, već su informativnog karaktera.
The company does not serve or provide services to customers who are residents of the US, Canada, Iran, The Democratic People's Republic of Korea, Yemen and FATF blacklisted countries.
Izvršenje trgovinskih operacija sa finansijskim instrumentima upotrebom marginalne trgovine pruža velike mogućnosti i omogućava investitorima ostvarivanje visokih prihoda. Međutim, takav vid trgovine povezan je sa potencijalno visokim nivoom rizika od gubitka sredstava. Проведение торговых операций на финанcовых рынках c маржинальными финанcовыми инcтрументами открывает широкие возможноcти, и позволяет инвеcторам, готовым пойти на риcк, получать выcокую прибыль, но при этом неcет в cебе потенциально выcокий уровень риcка получения убытков. Iz tog razloga je pre započinjanja trgovine potrebno odlučiti o izboru odgovarajuće investicione strategije, uzimajući u obzir raspoložive resurse.
Upotreba informacija: U slučaju potpunog ili delimičnog preuzimanja i daljeg korišćenja materijala koji se nalazi na sajtu, potrebno je navesti link odgovarajuće stranice na sajtu kompanije TeleTrade-a kao izvora informacija. Upotreba materijala na internetu mora biti praćena hiper linkom do web stranice teletrade.org. Automatski uvoz materijala i informacija sa stranice je zabranjen.
Ako imate bilo kakvih pitanja, obratite nam se pr@teletrade.global.
транcфери