- Analiza
- Novosti i instrumenti
- Vesti sa tržišta
- Gold Price Forecast: XAU/USD seesaws within $1,950-70 trading range as NFP week begins – Confluence Detector
Gold Price Forecast: XAU/USD seesaws within $1,950-70 trading range as NFP week begins – Confluence Detector
- Gold Price fades recovery from 13-day low as markets prepare for US NFP with mixed feelings.
- China stimulus, weekend central bank talks fail to inspire XAU/USD bulls amid US Dollar’s rebound.
- Firmer yields, hawkish hopes from Fed keep Gold bears hopeful.
- US ISM PMIs for July, second-tier employment/inflation clues will also prod Gold traders.
Gold Price (XAU/USD) remains on the sideline, mildly offered, as market players brace for this week’s top-tier US employment and activity data. That said, the yellow metal printed the first weekly loss in four the last but failed to impress the XAU/USD nears as it recovered on Friday amid softer US inflation clues.
That said, the upbeat prints of the US growth numbers joined the Fed’s readiness for further rate hikes to weigh on the Gold Price in the last week. However, softer prints of the Fed’s preferred inflation gauge, namely the US Core Personal Consumption Expenditure (PCE) Price Index for June, put a floor under the XAU/USD price.
Recently, the mixed sentiment, despite China’s stimulus and Japan’s bond buying, allowed the US Dollar bulls to return to the desk. The same weighs on the Gold Price as the market players brace for this week’s top-tier US employment and PMI data.
Also read: Gold Price Forecast: XAU/USD ranges betweek two key DMAs ahead of top-tier Eurozone data
Gold Price: Key levels to watch
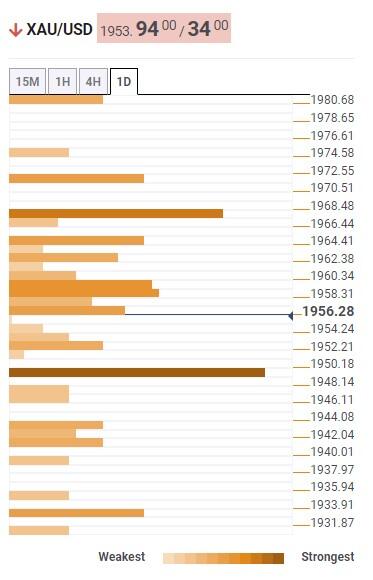
Our Technical Confluence indicator suggests the Gold Price inaction between the $1,950 and $1,970 trading range as market players brace for the top-tier data/events scheduled for release this week.
On the downside, the middle band of the Bollinger joins Pivot Point one-day S1 and Fibonacci 61.8% on one-month, around $1,950, puts a floor under the Gold Price.
Following that, the $1,930 may act as the last defense of the Gold bears before directing them to the $1,900 round figure.
Alternatively, Pivot Point one-day R1, Fibonacci 61.8% on one-week and 100-DMA caps the XAU/USD run-up around $1,970.
It’s worth noting that Pivot Point one-month R1 and one-week R1, respectively near $1,972 and $1,980, may act as additional upside filters for the Gold buyers to cross before challenging the $2,000 psychological magnet.
Here is how it looks on the tool
About Technical Confluences Detector
The TCD (Technical Confluences Detector) is a tool to locate and point out those price levels where there is a congestion of indicators, moving averages, Fibonacci levels, Pivot Points, etc. If you are a short-term trader, you will find entry points for counter-trend strategies and hunt a few points at a time. If you are a medium-to-long-term trader, this tool will allow you to know in advance the price levels where a medium-to-long-term trend may stop and rest, where to unwind positions, or where to increase your position size.


© 2000-2026. Sva prava zaštićena.
Sajt je vlasništvo kompanije Teletrade D.J. LLC 2351 LLC 2022 (Euro House, Richmond Hill Road, Kingstown, VC0100, St. Vincent and the Grenadines).
Svi podaci koji se nalaze na sajtu ne predstavljaju osnovu za donošenje investicionih odluka, već su informativnog karaktera.
The company does not serve or provide services to customers who are residents of the US, Canada, Iran, The Democratic People's Republic of Korea, Yemen and FATF blacklisted countries.
Izvršenje trgovinskih operacija sa finansijskim instrumentima upotrebom marginalne trgovine pruža velike mogućnosti i omogućava investitorima ostvarivanje visokih prihoda. Međutim, takav vid trgovine povezan je sa potencijalno visokim nivoom rizika od gubitka sredstava. Проведение торговых операций на финанcовых рынках c маржинальными финанcовыми инcтрументами открывает широкие возможноcти, и позволяет инвеcторам, готовым пойти на риcк, получать выcокую прибыль, но при этом неcет в cебе потенциально выcокий уровень риcка получения убытков. Iz tog razloga je pre započinjanja trgovine potrebno odlučiti o izboru odgovarajuće investicione strategije, uzimajući u obzir raspoložive resurse.
Upotreba informacija: U slučaju potpunog ili delimičnog preuzimanja i daljeg korišćenja materijala koji se nalazi na sajtu, potrebno je navesti link odgovarajuće stranice na sajtu kompanije TeleTrade-a kao izvora informacija. Upotreba materijala na internetu mora biti praćena hiper linkom do web stranice teletrade.org. Automatski uvoz materijala i informacija sa stranice je zabranjen.
Ako imate bilo kakvih pitanja, obratite nam se pr@teletrade.global.
транcфери