- Analiza
- Novosti i instrumenti
- Vesti sa tržišta
- AUD/JPY Price Analysis: Dives deep inside the Kumo after breaking a support trendline
AUD/JPY Price Analysis: Dives deep inside the Kumo after breaking a support trendline
- AUD/JPY extends losses for three straight days, breaking below a five-month support trendline at 93.40/50, registering marginal gains of 0.05%.
- The pair exhibits a downward bias, with indicators such as the Kijun and Tenkan-Sen lines signaling bearish momentum following the BoJ's tweaks to YCC.
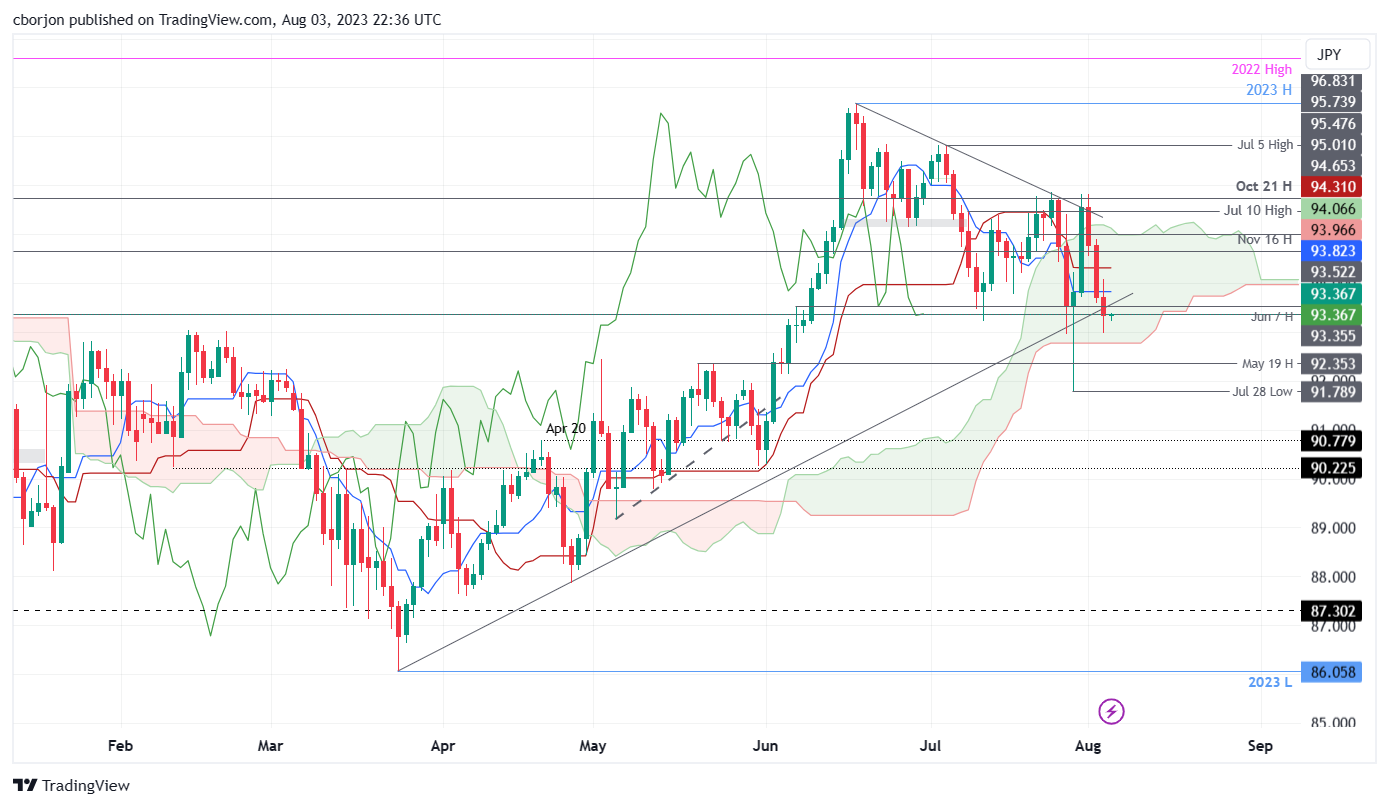
- Key support lies at the bottom of the Kumo at 92.78, with potential further downside to 91.78. Resistance can be found at the Tenkan-Sen at 93.82, with potential moves towards 94.00.
The AUD/JPY broke below a five-month-old support trendline at around 93.40/50 and extended its losses to three straight days, with the pair getting deep inside the Ichimoku Cloud (Kumo), about to turn bearish as the Asian session begins. At the time of writing, the AUD/JPY is trading at 93.37, registering minuscule gains of 0.05%.
AUD/JPY Price Analysis: Technical outlook
From a daily chart perspective, the AUD/JPY remains downward biased, with price action already below the Kijun and Tenkan- Sen lines, while the Chikou Span lies below the June 30 low, which sits at 95.59. In addition, the AUD/JPY breaking below a support trendline confirms that sellers are gathering momentum following the Bank of Japan (BoJ) decision to tweak the Yield Curve Control (YCC).
That said, AUD/JPY traders must be aware of volatility levels increasing in most Japanese Yen (JPY) pairs. Also, the AUD/JPY would remain subject to market sentiment, which could turn worse, if global equities continue to drop.
Hence, the AUD/JPY path of least resistance is downwards. The first support would be the bottom of the Kumo at 92.78, which once cleared, could pave the way to test the July 28 low at 91.78. Conversely, if AUD/JPY achieves a daily close above the Tenkan-Sen at 93.82, that will set a move towards 94.00. Further upside, could put in risk, Thursday’s high of 94.08.
AUD/JPY Price Action – Daily chart


© 2000-2026. Sva prava zaštićena.
Sajt je vlasništvo kompanije Teletrade D.J. LLC 2351 LLC 2022 (Euro House, Richmond Hill Road, Kingstown, VC0100, St. Vincent and the Grenadines).
Svi podaci koji se nalaze na sajtu ne predstavljaju osnovu za donošenje investicionih odluka, već su informativnog karaktera.
The company does not serve or provide services to customers who are residents of the US, Canada, Iran, The Democratic People's Republic of Korea, Yemen and FATF blacklisted countries.
Izvršenje trgovinskih operacija sa finansijskim instrumentima upotrebom marginalne trgovine pruža velike mogućnosti i omogućava investitorima ostvarivanje visokih prihoda. Međutim, takav vid trgovine povezan je sa potencijalno visokim nivoom rizika od gubitka sredstava. Проведение торговых операций на финанcовых рынках c маржинальными финанcовыми инcтрументами открывает широкие возможноcти, и позволяет инвеcторам, готовым пойти на риcк, получать выcокую прибыль, но при этом неcет в cебе потенциально выcокий уровень риcка получения убытков. Iz tog razloga je pre započinjanja trgovine potrebno odlučiti o izboru odgovarajuće investicione strategije, uzimajući u obzir raspoložive resurse.
Upotreba informacija: U slučaju potpunog ili delimičnog preuzimanja i daljeg korišćenja materijala koji se nalazi na sajtu, potrebno je navesti link odgovarajuće stranice na sajtu kompanije TeleTrade-a kao izvora informacija. Upotreba materijala na internetu mora biti praćena hiper linkom do web stranice teletrade.org. Automatski uvoz materijala i informacija sa stranice je zabranjen.
Ako imate bilo kakvih pitanja, obratite nam se pr@teletrade.global.
транcфери