- Analiza
- Novosti i instrumenti
- Vesti sa tržišta
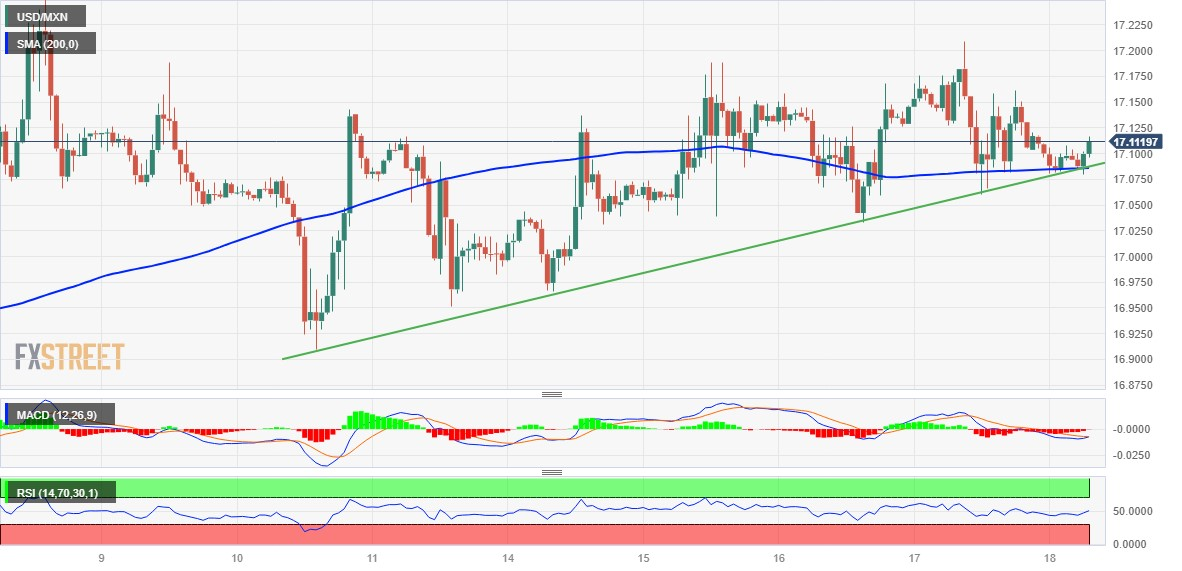
- USD/MXN Price Analysis: Manages to defend 200-hour SMA/ascending trend line confluence
USD/MXN Price Analysis: Manages to defend 200-hour SMA/ascending trend line confluence
- USD/MXN lacks any firm intraday direction and remains confined in a range on Friday.
- Mixed oscillators on hourly/daily charts warrant some caution for aggressive traders.
- A sustained move beyond 17.20 is needed to support prospects for any further gains.
The USD/MXN pair struggles to gain any meaningful traction on Friday and oscillates in a narrow trading band through the early part of the European session. Spot prices, however, manage to defend the 17.0800-17.0850 confluence support and for now, seem to have stalled the previous day's modest pullback from over a one-week high.
The aforementioned area comprises the 200-hour Simple Moving Average (SMA) and an ascending trend line extending from the August 10 swing low, which, in turn, should now act as a pivotal point for intraday traders. Meanwhile, technical indicators on the 1-hour chart are holding in the negative territory and support prospects for an eventual breakdown. That said, positive oscillators on 4-hour/daily charts warrant some caution before positioning for any further losses.
Hence, bearish traders are likely to wait for a sustained break and acceptance below the 17.0800-17.0850 region before placing fresh bets. The USD/MXN pair might then accelerate the slide towards the 17.0400 horizontal support en route to the 17.00 psychological mark. This is followed by last week's swing low, around the 16.9090 area, below which spot prices could drop to the 16.8200-16.7995 area en route to the next relevant support near the 16.7030-16.7025 region.
On the flip side, the 17.1450-17.1455 region is likely to act as an immediate hurdle ahead of the weekly top, around the 17.2070 area touched on Thursday. A sustained strength beyond has the potential to lift the USD/MXN pair towards the 17.2835 zone en route to the monthly peak, around the 17.4260 region. Some follow-through buying will be seen as a fresh trigger for bullish traders and pave the way for some meaningful appreciating move in the near term.
USD/MXN 1-hour chart
Technical levels to watch


© 2000-2026. Sva prava zaštićena.
Sajt je vlasništvo kompanije Teletrade D.J. LLC 2351 LLC 2022 (Euro House, Richmond Hill Road, Kingstown, VC0100, St. Vincent and the Grenadines).
Svi podaci koji se nalaze na sajtu ne predstavljaju osnovu za donošenje investicionih odluka, već su informativnog karaktera.
The company does not serve or provide services to customers who are residents of the US, Canada, Iran, The Democratic People's Republic of Korea, Yemen and FATF blacklisted countries.
Izvršenje trgovinskih operacija sa finansijskim instrumentima upotrebom marginalne trgovine pruža velike mogućnosti i omogućava investitorima ostvarivanje visokih prihoda. Međutim, takav vid trgovine povezan je sa potencijalno visokim nivoom rizika od gubitka sredstava. Проведение торговых операций на финанcовых рынках c маржинальными финанcовыми инcтрументами открывает широкие возможноcти, и позволяет инвеcторам, готовым пойти на риcк, получать выcокую прибыль, но при этом неcет в cебе потенциально выcокий уровень риcка получения убытков. Iz tog razloga je pre započinjanja trgovine potrebno odlučiti o izboru odgovarajuće investicione strategije, uzimajući u obzir raspoložive resurse.
Upotreba informacija: U slučaju potpunog ili delimičnog preuzimanja i daljeg korišćenja materijala koji se nalazi na sajtu, potrebno je navesti link odgovarajuće stranice na sajtu kompanije TeleTrade-a kao izvora informacija. Upotreba materijala na internetu mora biti praćena hiper linkom do web stranice teletrade.org. Automatski uvoz materijala i informacija sa stranice je zabranjen.
Ako imate bilo kakvih pitanja, obratite nam se pr@teletrade.global.
транcфери