- Analiza
- Novosti i instrumenti
- Vesti sa tržišta
- Natural Gas Price Analysis: XNG/USD consolidates in a range above 50-day SMA
Natural Gas Price Analysis: XNG/USD consolidates in a range above 50-day SMA
- Natural Gas price lacks any firm intraday direction and oscillates in a narrow band on Tuesday.
- The ascending trend-channel formation and acceptance above key moving averages favour bulls.
- A move beyond the overnight swing high is still needed to support prospects for additional gains.
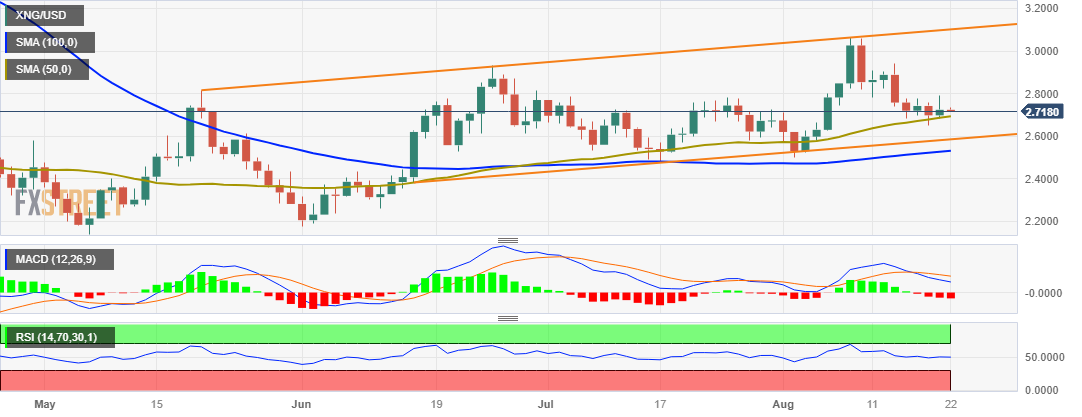
Natural Gas price struggles to gain any meaningful traction on Tuesday and oscillates in a narrow trading band, around the $2.7200 area during the Asian session. The technical setup, meanwhile, seems tilted in favour of bullish traders and suggests that the path of least resistance for the XNG/USD is to the upside.
The recent move-up witnessed over the past two months or so has been along an upward-sloping channel, which points to a well-established short-term bullish trend. This, along with the recent repeated bounce from the 100-day Simple Moving Average (SMA), validates the constructive outlook for the XNG/USD. That said, oscillators on the daily chart are yet to confirm the positive bias and warrant some caution for aggressive bullish traders.
Hence, it will be prudent to wait for some follow-through buying beyond the overnight swing high, around the $2.7900 area, before positioning for any meaningful appreciating move. The XNG/USD might then accelerate the positive move towards the $2.8540-$2.8640 horizontal barrier en route to the $2.9400 area and the $3.0000 psychological mark. The momentum could get extended towards the monthly peak, around the $3.0580 region.
On the flip side, the 50-day SMA, currently pegged near the $2.6955 area, is likely to protect the immediate downside ahead of last week's swing low, around the $2.6520 region. Some follow-through selling might expose the ascending channel support near the $2.5900-$2.5850 zone. This is followed by the 100-day SMA, around the $2.5300 area, which if broken will negative the positive outlook and shift the near-term bias in favour of bearish traders.
XNG/USD daily chart


© 2000-2026. Sva prava zaštićena.
Sajt je vlasništvo kompanije Teletrade D.J. LLC 2351 LLC 2022 (Euro House, Richmond Hill Road, Kingstown, VC0100, St. Vincent and the Grenadines).
Svi podaci koji se nalaze na sajtu ne predstavljaju osnovu za donošenje investicionih odluka, već su informativnog karaktera.
The company does not serve or provide services to customers who are residents of the US, Canada, Iran, The Democratic People's Republic of Korea, Yemen and FATF blacklisted countries.
Izvršenje trgovinskih operacija sa finansijskim instrumentima upotrebom marginalne trgovine pruža velike mogućnosti i omogućava investitorima ostvarivanje visokih prihoda. Međutim, takav vid trgovine povezan je sa potencijalno visokim nivoom rizika od gubitka sredstava. Проведение торговых операций на финанcовых рынках c маржинальными финанcовыми инcтрументами открывает широкие возможноcти, и позволяет инвеcторам, готовым пойти на риcк, получать выcокую прибыль, но при этом неcет в cебе потенциально выcокий уровень риcка получения убытков. Iz tog razloga je pre započinjanja trgovine potrebno odlučiti o izboru odgovarajuće investicione strategije, uzimajući u obzir raspoložive resurse.
Upotreba informacija: U slučaju potpunog ili delimičnog preuzimanja i daljeg korišćenja materijala koji se nalazi na sajtu, potrebno je navesti link odgovarajuće stranice na sajtu kompanije TeleTrade-a kao izvora informacija. Upotreba materijala na internetu mora biti praćena hiper linkom do web stranice teletrade.org. Automatski uvoz materijala i informacija sa stranice je zabranjen.
Ako imate bilo kakvih pitanja, obratite nam se pr@teletrade.global.
транcфери