- Analiza
- Novosti i instrumenti
- Vesti sa tržišta
- Silver Price Analysis: XAG/USD retreats from multi-week top, holds above $24.00 mark
Silver Price Analysis: XAG/USD retreats from multi-week top, holds above $24.00 mark
- Silver edges lower on Monday and corrects further from over a three-month high.
- The 200-period SMA on the 4-hour chart to act as a pivotal point and limit losses.
- Bulls might wait for a move beyond the $24.35-40 area before placing fresh bets.
Silver attracts some intraday selling on the first day of a new week and moves away from over a three-week high, around the $24.35-$24.40 region touched on Friday. The white metal sticks to a mildly negative tone through the early part of the European session, albeit manages to hold its neck above the $24.00 round-figure mark.
Any subsequent slide below the aforementioned handle is more likely to find some support near the $23.85-$23.80 area, or the 200-period Simple Moving Average (SMA) on the 4-hour chart. Against the backdrop of positive technical indicators on 4-hour/daily charts, the said area could act as a pivotal point for intraday traders and help limit any further decline.
Silver 4-hour chart
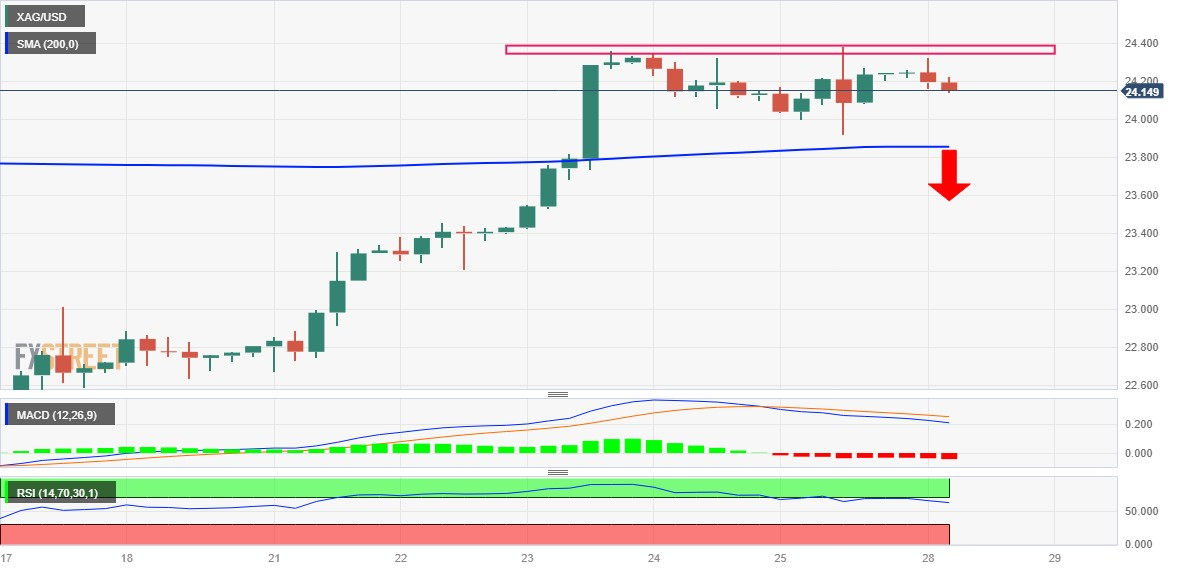
A sustained break below, however, might prompt some technical selling and drag the XAG/USD towards the $23.55 region. This is closely followed by support near the $23.40 area, representing the 200-day SMA, which if broken decisively might shift the near-term bias in favour of bearish traders and pave the way for some meaningful downside.
On the flip side, the $24.35-$24.40 area might continue to act as an immediate strong resistance, which if cleared should allow the XAG/USD to surpass the $24.55-$24.60 intermediate hurdle and aim to reclaim the $25.00 psychological mark. The positive move could get extended further towards the $25.25 zone, or the July monthly swing high, en route to the $26.00 mark.
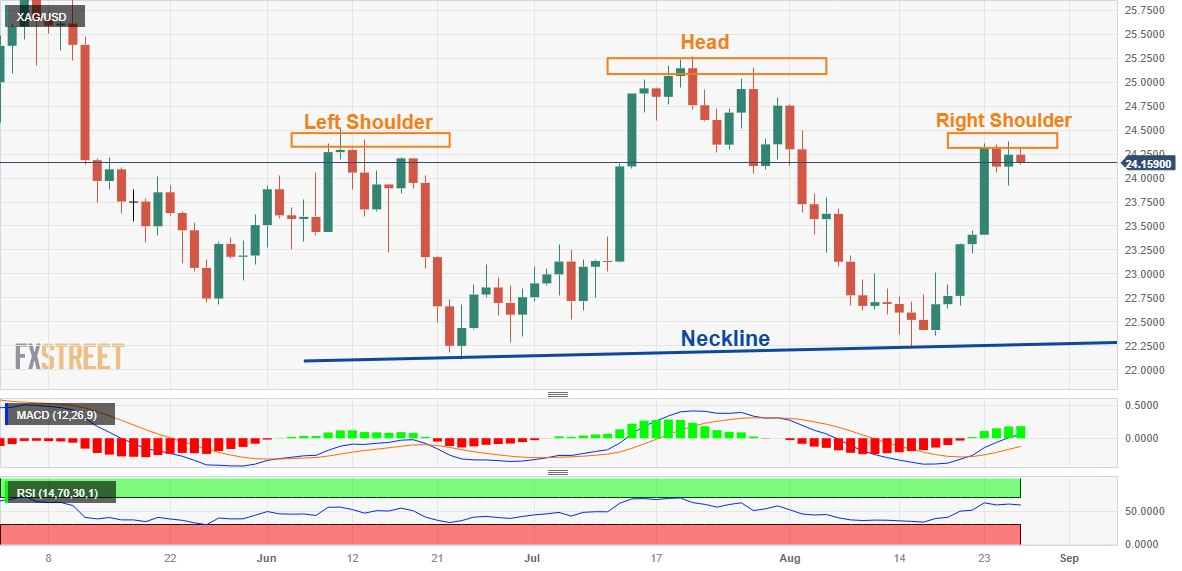
Zooming out to the daily chart, the recent price action witnessed since early June seems to constitute the formation of a bearish head and shoulders pattern on the daily chart. The pattern, however, will be confirmed on a sustained break below the neckline support, around the $22.20-$22.10 region.
XAG/USD daily chart
Key levels to watch


© 2000-2026. Sva prava zaštićena.
Sajt je vlasništvo kompanije Teletrade D.J. LLC 2351 LLC 2022 (Euro House, Richmond Hill Road, Kingstown, VC0100, St. Vincent and the Grenadines).
Svi podaci koji se nalaze na sajtu ne predstavljaju osnovu za donošenje investicionih odluka, već su informativnog karaktera.
The company does not serve or provide services to customers who are residents of the US, Canada, Iran, The Democratic People's Republic of Korea, Yemen and FATF blacklisted countries.
Izvršenje trgovinskih operacija sa finansijskim instrumentima upotrebom marginalne trgovine pruža velike mogućnosti i omogućava investitorima ostvarivanje visokih prihoda. Međutim, takav vid trgovine povezan je sa potencijalno visokim nivoom rizika od gubitka sredstava. Проведение торговых операций на финанcовых рынках c маржинальными финанcовыми инcтрументами открывает широкие возможноcти, и позволяет инвеcторам, готовым пойти на риcк, получать выcокую прибыль, но при этом неcет в cебе потенциально выcокий уровень риcка получения убытков. Iz tog razloga je pre započinjanja trgovine potrebno odlučiti o izboru odgovarajuće investicione strategije, uzimajući u obzir raspoložive resurse.
Upotreba informacija: U slučaju potpunog ili delimičnog preuzimanja i daljeg korišćenja materijala koji se nalazi na sajtu, potrebno je navesti link odgovarajuće stranice na sajtu kompanije TeleTrade-a kao izvora informacija. Upotreba materijala na internetu mora biti praćena hiper linkom do web stranice teletrade.org. Automatski uvoz materijala i informacija sa stranice je zabranjen.
Ako imate bilo kakvih pitanja, obratite nam se pr@teletrade.global.
транcфери