- Analiza
- Novosti i instrumenti
- Vesti sa tržišta
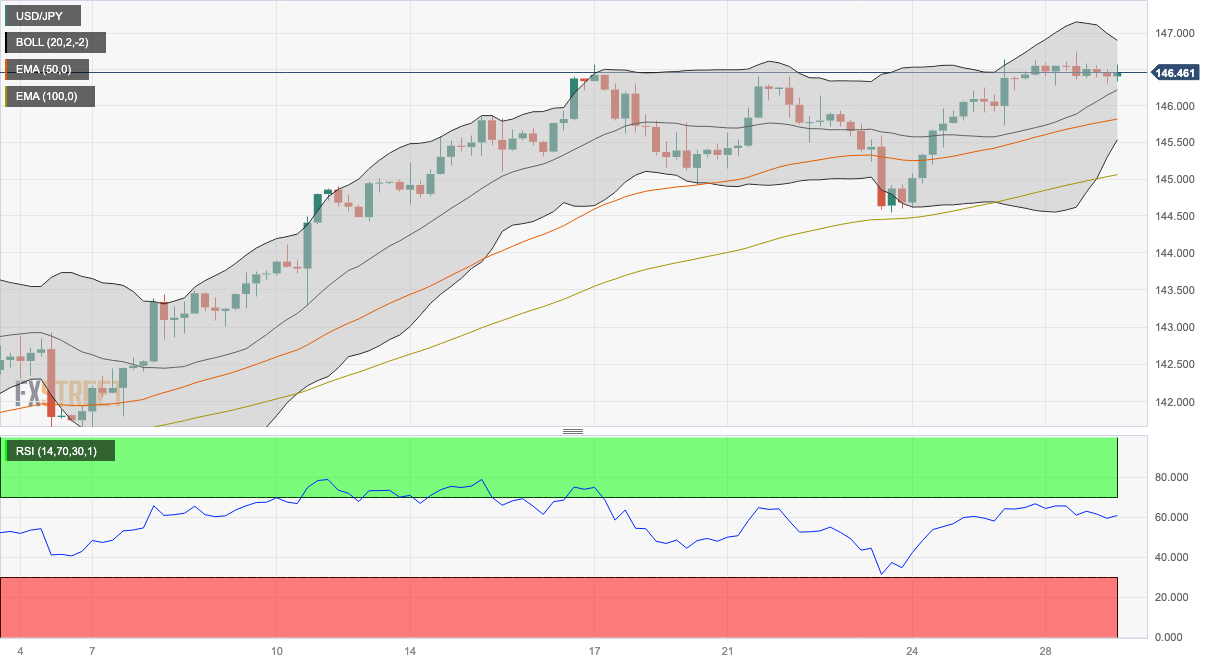
- USD/JPY Price Analysis: Flat-lines near 146.40 ahead of US economic data
USD/JPY Price Analysis: Flat-lines near 146.40 ahead of US economic data
- USD/JPY holds above the 50- and 100-hour EMAs with an upward slope.
- A Year-To-Date (YTD) high of 146.75 will be the first resistance level for the pair.
- The initial contention for USD/JPY is located at 145.80.
The USD/JPY pair oscillates in a narrow range near 146.42 during the early European trading hours on Tuesday. Market participants prefer to wait on the sidelines ahead of the release of US CB Consumer Confidence and JOLTS Job Openings for July due later in the North American session.
Apart from this, the Japanese Unemployment Rate increased to 2.7% in July from 2.5% in June, according to the latest figures from the Statistics Bureau. The figure rose for the first time in four months and exerted pressure on the Bank of Japan (BoJ) and the government. However, traders turn cautious to place buying bets amid the fear of FX intervention by the BoJ.
Technically, the USD/JPY pair stands above the 50- and 100-hour Exponential Moving Averages (EMAs) with an upward slope, which means the path of least resistance is to the upside for the major pair.
The immediate resistance level for USD/JPY appears at a Year-To-Date (YTD) high of 146.75. Any meaningful follow-through buying will see a rally to the boundary of the Bollinger Band and a psychological round mark at the 146.90-147.00 region. Further north, the next barrier to watch for USD/JPY is located at 147.55 (a high of November 2022), followed by 148.00 (a round figure).
On the downside, the initial contention for the major pair is located at 145.80 (50-hour EMA). The next contention level emerges near a lower limit of the Bollinger Band at 145.55. Any intraday pullback below the latter would expose the next downside stop at 145.05 (100-hour EMA), and finally at 144.55 (a low of August 23).
It’s worth noting that the Relative Strength Index (RSI) stands in bullish territory above 50, which indicates that the upside momentum has been activated for the time being.
USD/JPY four-hour chart


© 2000-2026. Sva prava zaštićena.
Sajt je vlasništvo kompanije Teletrade D.J. LLC 2351 LLC 2022 (Euro House, Richmond Hill Road, Kingstown, VC0100, St. Vincent and the Grenadines).
Svi podaci koji se nalaze na sajtu ne predstavljaju osnovu za donošenje investicionih odluka, već su informativnog karaktera.
The company does not serve or provide services to customers who are residents of the US, Canada, Iran, The Democratic People's Republic of Korea, Yemen and FATF blacklisted countries.
Izvršenje trgovinskih operacija sa finansijskim instrumentima upotrebom marginalne trgovine pruža velike mogućnosti i omogućava investitorima ostvarivanje visokih prihoda. Međutim, takav vid trgovine povezan je sa potencijalno visokim nivoom rizika od gubitka sredstava. Проведение торговых операций на финанcовых рынках c маржинальными финанcовыми инcтрументами открывает широкие возможноcти, и позволяет инвеcторам, готовым пойти на риcк, получать выcокую прибыль, но при этом неcет в cебе потенциально выcокий уровень риcка получения убытков. Iz tog razloga je pre započinjanja trgovine potrebno odlučiti o izboru odgovarajuće investicione strategije, uzimajući u obzir raspoložive resurse.
Upotreba informacija: U slučaju potpunog ili delimičnog preuzimanja i daljeg korišćenja materijala koji se nalazi na sajtu, potrebno je navesti link odgovarajuće stranice na sajtu kompanije TeleTrade-a kao izvora informacija. Upotreba materijala na internetu mora biti praćena hiper linkom do web stranice teletrade.org. Automatski uvoz materijala i informacija sa stranice je zabranjen.
Ako imate bilo kakvih pitanja, obratite nam se pr@teletrade.global.
транcфери