- Analiza
- Novosti i instrumenti
- Vesti sa tržišta
- USD/MXN Price Analysis: Flirts with 100-day SMA support, below 38.2% Fibo. level
USD/MXN Price Analysis: Flirts with 100-day SMA support, below 38.2% Fibo. level
- USD/MXN stalls its retracement slide from a multi-month top near the 100-day SMA support.
- Positive oscillators on the daily chart warrant caution before placing aggressive bearish bets.
- Strength back above the 38.2% Fibo. level will set the stage for a further appreciating move.
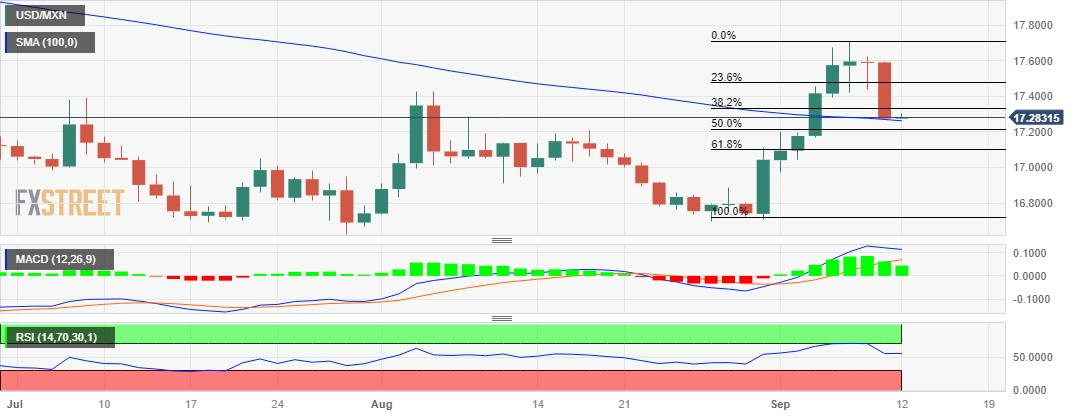
The USD/MXN pair finds some support near the 100-day Simple Moving Average (SMA), currently around the 17.25 region, and for now, seems to have stalled its retracement slide from over a three-month peak touched last week. Spot prices, however, struggle to register any meaningful recovery and remain below the 17.30 level through the Asian session.
From a technical perspective, the overnight sustained break and acceptance below the 38.2% Fibonacci retracement level of the recent rally from the August monthly swing low favours bearish traders. That said, oscillators on the daily chart –though have been easing from higher levels – are still holding in the positive territory. This, in turn, warrants some caution before positioning for any further depreciating move.
A convincing break below the 100-day SMA, however, might prompt some technical selling and expose the 50% Fibo. level, around the 17.20 level. The subsequent fall has the potential to drag the USD/MXN pair towards the 17.10 region, or the 61.8% Fibo. level. The latter should act as a key pivotal point, which if broken decisively could make spot prices vulnerable to extend the decline further below the 17.00 mark.
On the flip side, the 38.2% Fibo. level, around the 17.35 region, is likely to cap the immediate upside, above which the USD/MXN pair could climb to the 17.45-17.50 hurdle, or the 23.6% Fibo. level. This is followed by the multi-month top, around the 17.70 zone, which if cleared decisively will set the stage for the resumption of the recent strong appreciating move witnessed over the past two weeks or so.
USD/MXN daily chart
Technical levels to watch


© 2000-2026. Sva prava zaštićena.
Sajt je vlasništvo kompanije Teletrade D.J. LLC 2351 LLC 2022 (Euro House, Richmond Hill Road, Kingstown, VC0100, St. Vincent and the Grenadines).
Svi podaci koji se nalaze na sajtu ne predstavljaju osnovu za donošenje investicionih odluka, već su informativnog karaktera.
The company does not serve or provide services to customers who are residents of the US, Canada, Iran, The Democratic People's Republic of Korea, Yemen and FATF blacklisted countries.
Izvršenje trgovinskih operacija sa finansijskim instrumentima upotrebom marginalne trgovine pruža velike mogućnosti i omogućava investitorima ostvarivanje visokih prihoda. Međutim, takav vid trgovine povezan je sa potencijalno visokim nivoom rizika od gubitka sredstava. Проведение торговых операций на финанcовых рынках c маржинальными финанcовыми инcтрументами открывает широкие возможноcти, и позволяет инвеcторам, готовым пойти на риcк, получать выcокую прибыль, но при этом неcет в cебе потенциально выcокий уровень риcка получения убытков. Iz tog razloga je pre započinjanja trgovine potrebno odlučiti o izboru odgovarajuće investicione strategije, uzimajući u obzir raspoložive resurse.
Upotreba informacija: U slučaju potpunog ili delimičnog preuzimanja i daljeg korišćenja materijala koji se nalazi na sajtu, potrebno je navesti link odgovarajuće stranice na sajtu kompanije TeleTrade-a kao izvora informacija. Upotreba materijala na internetu mora biti praćena hiper linkom do web stranice teletrade.org. Automatski uvoz materijala i informacija sa stranice je zabranjen.
Ako imate bilo kakvih pitanja, obratite nam se pr@teletrade.global.
транcфери