- Analiza
- Novosti i instrumenti
- Vesti sa tržišta
- USD/INR Price Analysis: Bounces off one-week low, remains below 83.00 mark
USD/INR Price Analysis: Bounces off one-week low, remains below 83.00 mark
- USD/INR states a modest recovery from a one-week low touched this Thursday.
- The technical setup favours bulls and supports prospects for a further move up.
- A convincing break below the 100/200-day SMAs will negate the positive bias.
The USD/INR pair attracts some dip-buying near the 82.80 area, or a one-week low touched during the Asian session this Tuesday and for now, seems to have snapped a three-day losing streak. Spot prices, however, remain below the 83.00 round-figure mark, the near-term bias seems tilted in favour of bullish traders.
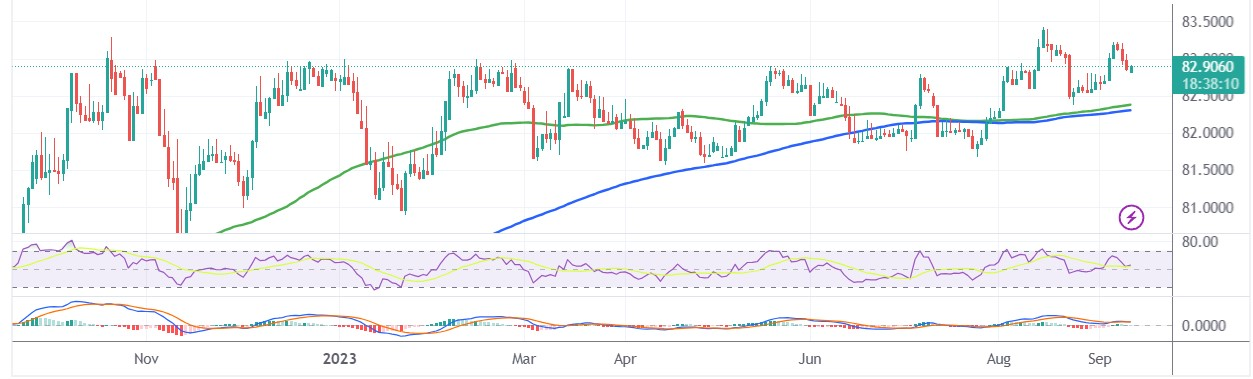
The positive outlook is reinforced by the fact that the USD/INR pair is holding comfortably above technically significant 100-day and 200-day Simple Moving Averages (SMAs). Moreover, positive oscillators on the daily chart – though have been losing some traction – suggest that the path of least resistance for spot prices is to the upside.
A sustained strength beyond the 83.00 mark will reaffirm the constructive setup and lift the pair back towards last week's swing high, around the 83.20-83.25 region. This is followed by the 83.45 region, or the record high touched in August, which if cleared decisively will be seen as a fresh trigger for bulls and pave the way for additional gains.
On the flip side, weakness below the 82.80-82.75 region might continue to attract some dip-buying and remain limited near the 82.40-82.30 confluence, comprising the 100-day and the 200-day SMAs. The latter should act as a pivotal point, which if broken will make the USD/INR pair vulnerable to accelerate the slide towards the 82.00 round figure.
Some follow-through selling below the July monthly swing low, around the 81.70-81.65 region, will suggest that spot prices have formed a near-term top and pave the way for a deeper corrective decline. The USD/INR pair might then weaken further towards the 81.35 intermediate support before eventually dropping towards testing sub-81.00 levels.
USD/INR daily chart
Technical levels to watch


© 2000-2026. Sva prava zaštićena.
Sajt je vlasništvo kompanije Teletrade D.J. LLC 2351 LLC 2022 (Euro House, Richmond Hill Road, Kingstown, VC0100, St. Vincent and the Grenadines).
Svi podaci koji se nalaze na sajtu ne predstavljaju osnovu za donošenje investicionih odluka, već su informativnog karaktera.
The company does not serve or provide services to customers who are residents of the US, Canada, Iran, The Democratic People's Republic of Korea, Yemen and FATF blacklisted countries.
Izvršenje trgovinskih operacija sa finansijskim instrumentima upotrebom marginalne trgovine pruža velike mogućnosti i omogućava investitorima ostvarivanje visokih prihoda. Međutim, takav vid trgovine povezan je sa potencijalno visokim nivoom rizika od gubitka sredstava. Проведение торговых операций на финанcовых рынках c маржинальными финанcовыми инcтрументами открывает широкие возможноcти, и позволяет инвеcторам, готовым пойти на риcк, получать выcокую прибыль, но при этом неcет в cебе потенциально выcокий уровень риcка получения убытков. Iz tog razloga je pre započinjanja trgovine potrebno odlučiti o izboru odgovarajuće investicione strategije, uzimajući u obzir raspoložive resurse.
Upotreba informacija: U slučaju potpunog ili delimičnog preuzimanja i daljeg korišćenja materijala koji se nalazi na sajtu, potrebno je navesti link odgovarajuće stranice na sajtu kompanije TeleTrade-a kao izvora informacija. Upotreba materijala na internetu mora biti praćena hiper linkom do web stranice teletrade.org. Automatski uvoz materijala i informacija sa stranice je zabranjen.
Ako imate bilo kakvih pitanja, obratite nam se pr@teletrade.global.
транcфери