- Analiza
- Novosti i instrumenti
- Vesti sa tržišta
- Natural Gas Price Analysis: XNG/USD flirts with last week's swing low, below $3.4500
Natural Gas Price Analysis: XNG/USD flirts with last week's swing low, below $3.4500
- Natural Gas price drifts lower for the third straight day and moves away from a multi-month top.
- The technical setup favours bulls and supports prospects for the emergence of some dip-buying.
- A break below the $3.0650 resistance-turned-support is needed to negate the positive outlook.
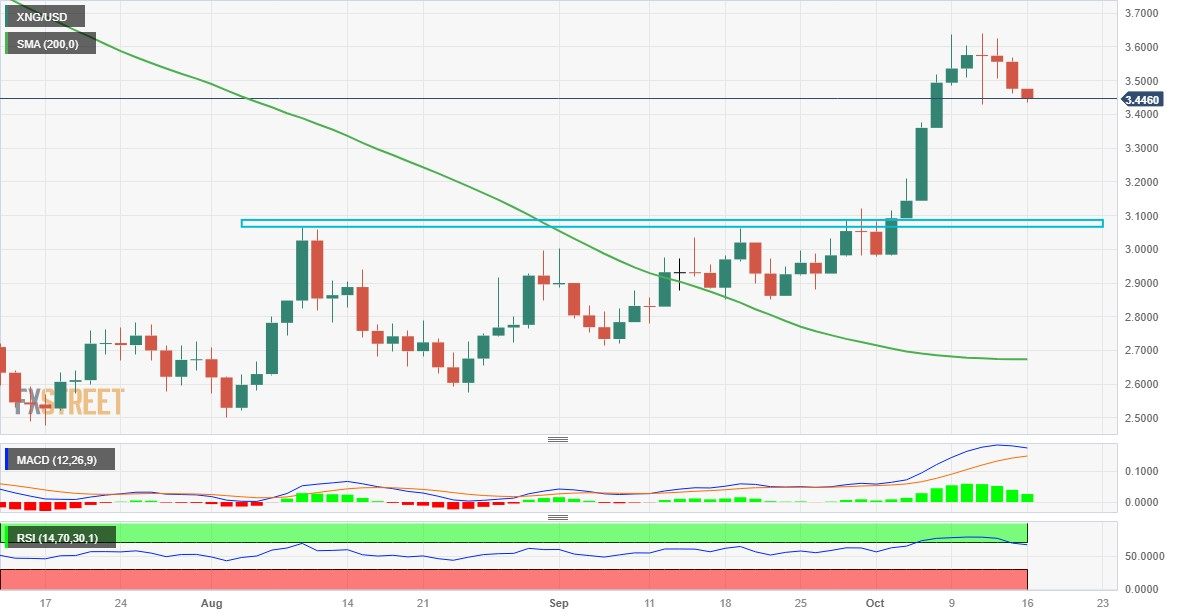
Natural Gas price extends last week's retracement slide from a nine-month peak, around the $3.6350-$3.6400 area, and remains under some selling pressure for the third successive day on Monday. The XNG/USD trades around the $3.4400 level, down over 1% during the Asian session, though the technical setup warrants some caution before positioning for any further depreciating move.
Oscillators on the daily chart are holding comfortably in the positive territory and the Relative Strength (RSI) has also eased from an extremely overbought zone. This, along with the recent breakout through the $3.0650 strong horizontal barrier, suggests that the path of least resistance for the XNG/USD is to the upside and supports prospects for the emergence of some dip-buying at lower levels.
In the meantime, the $3.3600 level is likely to protect the immediate downside ahead of the $3.2100-$3.1960 support zone. This is followed by the $3.0650 resistance-turned-support, which now coincides with the 200-period Simple Moving Average (SMA) on the 4-hour chart. A convincing break below the latter could negate the positive outlook and prompt technical selling around the XNG/USD.
On the flip side, the $3.5000 area now seems to act as an immediate hurdle, above which the commodity could climb back to the multi-month top, around the $3.6350-$3.6400 region touched last week. Some follow-through buying will be seen as a fresh trigger for bulls and lift the XNG/USD to the $3.8770 en route to the $4.000 mark and the YTD high, around the $4.0380 touched in January.
XNG/USD daily chart


© 2000-2026. Sva prava zaštićena.
Sajt je vlasništvo kompanije Teletrade D.J. LLC 2351 LLC 2022 (Euro House, Richmond Hill Road, Kingstown, VC0100, St. Vincent and the Grenadines).
Svi podaci koji se nalaze na sajtu ne predstavljaju osnovu za donošenje investicionih odluka, već su informativnog karaktera.
The company does not serve or provide services to customers who are residents of the US, Canada, Iran, The Democratic People's Republic of Korea, Yemen and FATF blacklisted countries.
Izvršenje trgovinskih operacija sa finansijskim instrumentima upotrebom marginalne trgovine pruža velike mogućnosti i omogućava investitorima ostvarivanje visokih prihoda. Međutim, takav vid trgovine povezan je sa potencijalno visokim nivoom rizika od gubitka sredstava. Проведение торговых операций на финанcовых рынках c маржинальными финанcовыми инcтрументами открывает широкие возможноcти, и позволяет инвеcторам, готовым пойти на риcк, получать выcокую прибыль, но при этом неcет в cебе потенциально выcокий уровень риcка получения убытков. Iz tog razloga je pre započinjanja trgovine potrebno odlučiti o izboru odgovarajuće investicione strategije, uzimajući u obzir raspoložive resurse.
Upotreba informacija: U slučaju potpunog ili delimičnog preuzimanja i daljeg korišćenja materijala koji se nalazi na sajtu, potrebno je navesti link odgovarajuće stranice na sajtu kompanije TeleTrade-a kao izvora informacija. Upotreba materijala na internetu mora biti praćena hiper linkom do web stranice teletrade.org. Automatski uvoz materijala i informacija sa stranice je zabranjen.
Ako imate bilo kakvih pitanja, obratite nam se pr@teletrade.global.
транcфери