- Analiza
- Novosti i instrumenti
- Vesti sa tržišta
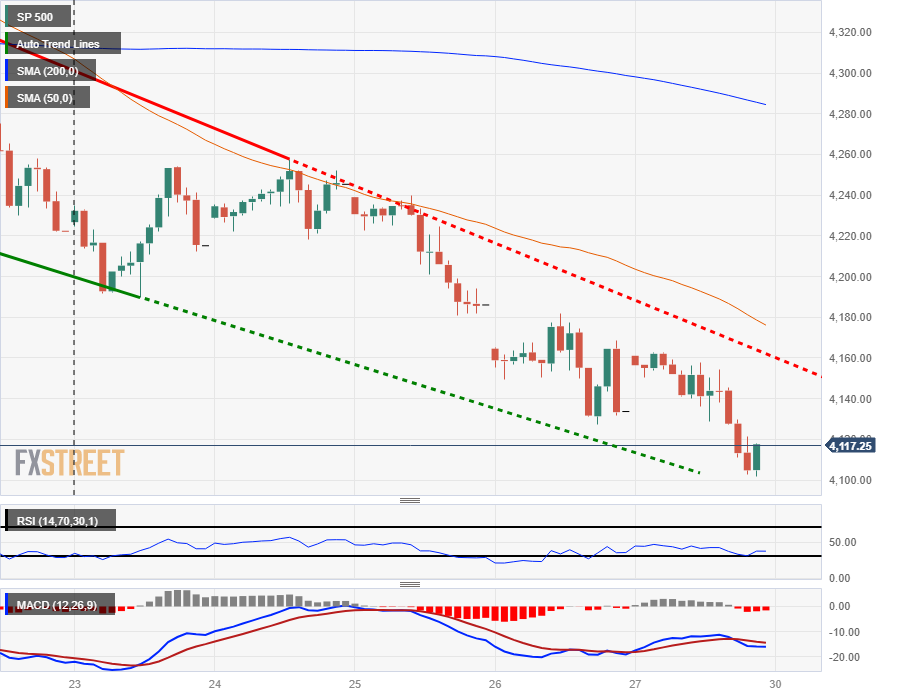
- S&P 500 enters correction territory, ending Friday just shy of $4,100
S&P 500 enters correction territory, ending Friday just shy of $4,100
- The S&P 500 is extending declines into a two-week stretch, down over 5% for the period.
- S&P index down over 10% from the July peak at $4,600, enters correction territory.
- US Equities mixed on Friday as recession fears, lopsided earnings reports drag on stocks.
The Standard & Poor's index marked in the second losing week in a row, entering correction territory after falling 10% from July's high near $4,600.
The S&P 500 index closed Friday down around 20 points, shedding half a percent close out at $4,117.37, with the Dow Jones Industrial Average sinking over 366 points to shed 1.12%, closing Friday at $32417.59.
The NASDAQ Composite index bucked the bearish trend for Friday, closing up 47.41 points to end the day up almost 0.4%, closing at $12,643 plus one penny.
Equities got pushed broadly lower as inflation continues to remain a sticky problem for the Federal Reserve (Fed), with the US Personal Consumption Expenditure (PCE) Index showed consumer price spending rise by its fastest month-on-month pace since May, with the annual PCE cooling slightly into September, bringing "higher for longer" interest rate concerns back to the forefront.
The Fed is slated for another rate call next Wednesday, and while money markets are pricing in an expected rate hold next week, odds of an additional rate hike at December are steadily rising as the US economy remains firm compared to global competitors and inflation remains stubbornly higher than expected.
S&P Technical Outlook
The S&P stopped just short of slipping back into $4,100 in Friday's mostly bearish trading, and the major equity index continues to backslide, entering correction territory from July's peaks, and the S&P has locked in two consecutive weeks of red on the charts.
Daily candlesticks have tumbled past the 200-day Simple Moving Average (SMA) as bearish momentum firms up on the chart paper, and the last swing high into $4,400 sees added technical resistance from the 50-day SMA, currently settling into $4,350.
S&P Hourly Chart
S&P Technical Levels


© 2000-2026. Sva prava zaštićena.
Sajt je vlasništvo kompanije Teletrade D.J. LLC 2351 LLC 2022 (Euro House, Richmond Hill Road, Kingstown, VC0100, St. Vincent and the Grenadines).
Svi podaci koji se nalaze na sajtu ne predstavljaju osnovu za donošenje investicionih odluka, već su informativnog karaktera.
The company does not serve or provide services to customers who are residents of the US, Canada, Iran, The Democratic People's Republic of Korea, Yemen and FATF blacklisted countries.
Izvršenje trgovinskih operacija sa finansijskim instrumentima upotrebom marginalne trgovine pruža velike mogućnosti i omogućava investitorima ostvarivanje visokih prihoda. Međutim, takav vid trgovine povezan je sa potencijalno visokim nivoom rizika od gubitka sredstava. Проведение торговых операций на финанcовых рынках c маржинальными финанcовыми инcтрументами открывает широкие возможноcти, и позволяет инвеcторам, готовым пойти на риcк, получать выcокую прибыль, но при этом неcет в cебе потенциально выcокий уровень риcка получения убытков. Iz tog razloga je pre započinjanja trgovine potrebno odlučiti o izboru odgovarajuće investicione strategije, uzimajući u obzir raspoložive resurse.
Upotreba informacija: U slučaju potpunog ili delimičnog preuzimanja i daljeg korišćenja materijala koji se nalazi na sajtu, potrebno je navesti link odgovarajuće stranice na sajtu kompanije TeleTrade-a kao izvora informacija. Upotreba materijala na internetu mora biti praćena hiper linkom do web stranice teletrade.org. Automatski uvoz materijala i informacija sa stranice je zabranjen.
Ako imate bilo kakvih pitanja, obratite nam se pr@teletrade.global.
транcфери