- Analiza
- Novosti i instrumenti
- Vesti sa tržišta
- AUD/NZD Technical Analysis: Aussie trapped in tight congestion with Kiwi near 1.0725
AUD/NZD Technical Analysis: Aussie trapped in tight congestion with Kiwi near 1.0725
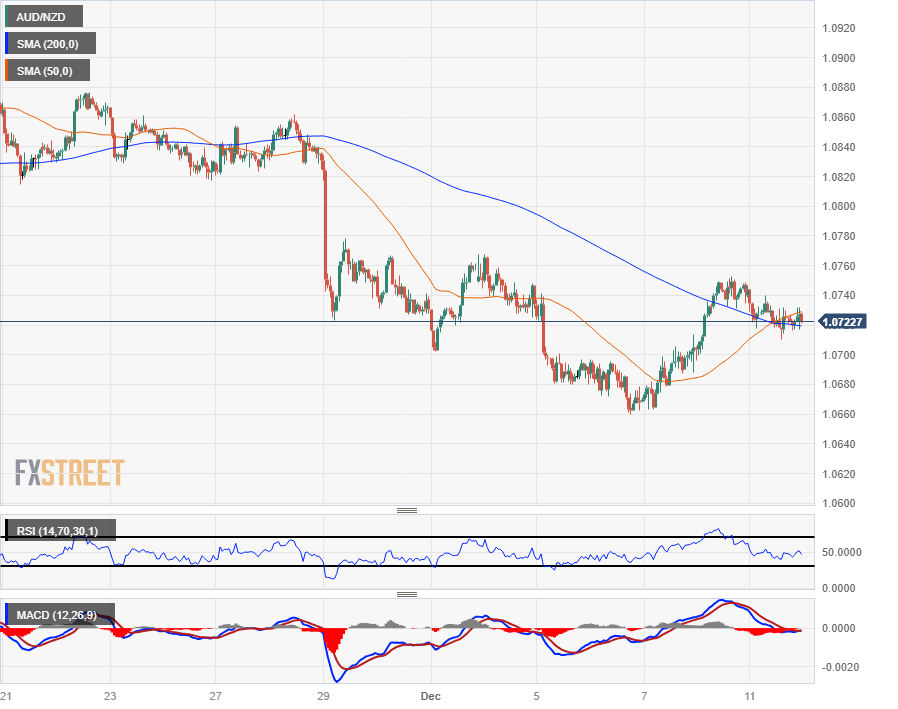
- AUD/NZD pulls back on Monday from 1.0750, but is still primed for further topside.
- 1.0650 continues to hold as a firm technical floor for the pair.
The AUD/NZD is getting hamstrung in the midrange as intraday price action gets caught in the negative space between the 50-hour and 200-hour Simple Moving Averages (SMA) after a near-term bullish crossover of the intraday moving averages.
The Aussie (AUD) saw a bullish rebound last week, taking the AUD/NZD back into the 1.0740 level after waffling to a seven-week low near 1.0650. Sideways momentum has been the overall trend for the AUD/NZD through most of 2023, but the pair remains down from late November’s last swing high into 1.0860, leaving the door open for near-term bullish plays.
Australian Dollar price this week
The table below shows the percentage change of Australian Dollar (AUD) against listed major currencies this week. Australian Dollar was the strongest against the Japanese Yen.
| USD | EUR | GBP | CAD | AUD | JPY | NZD | CHF | |
| USD | -0.01% | -0.02% | -0.05% | 0.24% | 0.78% | 0.01% | -0.15% | |
| EUR | 0.01% | -0.02% | -0.04% | 0.24% | 0.77% | 0.01% | -0.14% | |
| GBP | 0.03% | 0.02% | -0.02% | 0.26% | 0.80% | 0.03% | -0.12% | |
| CAD | 0.05% | 0.04% | 0.02% | 0.28% | 0.83% | 0.05% | -0.10% | |
| AUD | -0.24% | -0.24% | -0.26% | -0.28% | 0.53% | -0.23% | -0.38% | |
| JPY | -0.78% | -0.79% | -0.90% | -0.84% | -0.54% | -0.78% | -0.94% | |
| NZD | -0.01% | -0.01% | -0.03% | -0.05% | 0.22% | 0.76% | -0.14% | |
| CHF | 0.15% | 0.14% | 0.12% | 0.10% | 0.38% | 0.93% | 0.15% |
The heat map shows percentage changes of major currencies against each other. The base currency is picked from the left column, while the quote currency is picked from the top row. For example, if you pick the Euro from the left column and move along the horizontal line to the Japanese Yen, the percentage change displayed in the box will represent EUR (base)/JPY (quote).
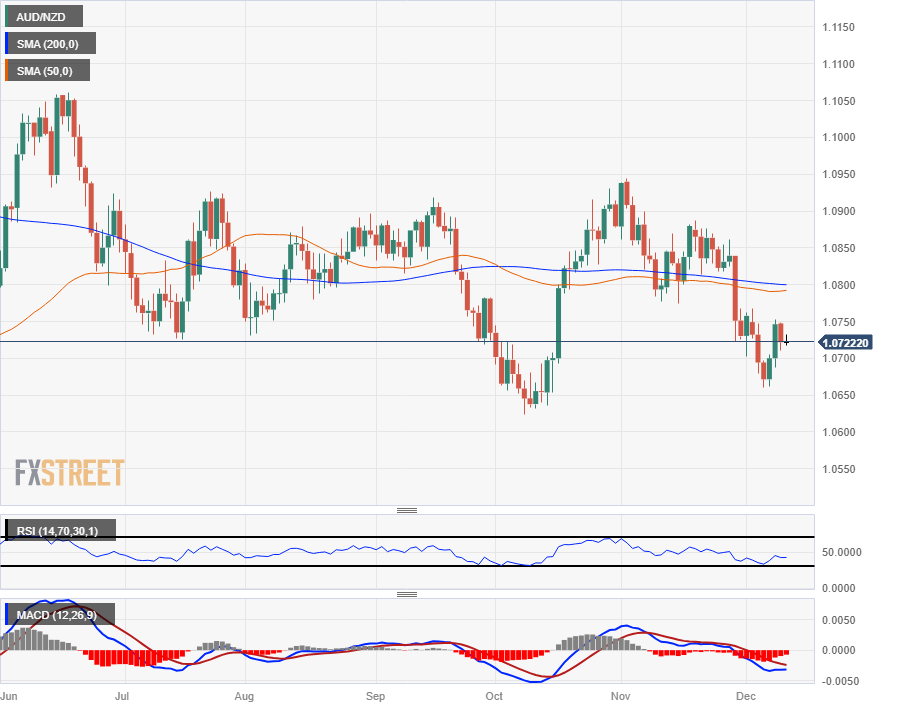
Daily candlesticks look notably sideways for the AUD/NZD, with the pair channeling around the 200-day SMA near the 1.0800 handle. 1.0650 represents a notable technical support region for the pair with multiple rebound zones baked into the price level, and a bullish extension will see the pair taking a fresh run at a long-running technical resistance zone near 1.0900 that has vexed long-term Aussie bulls for most of the year.
Moving averages and technical indicators are mechanically breaking with long-term midrange chart action limiting data series, and the 50-day and 200-day SMAs are drifting in parallel near the 1.0800 handle.
AUD/NZD Hourly Chart
AUD/NZD Daily Chart
AUD/NZD Technical Levels


© 2000-2026. Sva prava zaštićena.
Sajt je vlasništvo kompanije Teletrade D.J. LLC 2351 LLC 2022 (Euro House, Richmond Hill Road, Kingstown, VC0100, St. Vincent and the Grenadines).
Svi podaci koji se nalaze na sajtu ne predstavljaju osnovu za donošenje investicionih odluka, već su informativnog karaktera.
The company does not serve or provide services to customers who are residents of the US, Canada, Iran, The Democratic People's Republic of Korea, Yemen and FATF blacklisted countries.
Izvršenje trgovinskih operacija sa finansijskim instrumentima upotrebom marginalne trgovine pruža velike mogućnosti i omogućava investitorima ostvarivanje visokih prihoda. Međutim, takav vid trgovine povezan je sa potencijalno visokim nivoom rizika od gubitka sredstava. Проведение торговых операций на финанcовых рынках c маржинальными финанcовыми инcтрументами открывает широкие возможноcти, и позволяет инвеcторам, готовым пойти на риcк, получать выcокую прибыль, но при этом неcет в cебе потенциально выcокий уровень риcка получения убытков. Iz tog razloga je pre započinjanja trgovine potrebno odlučiti o izboru odgovarajuće investicione strategije, uzimajući u obzir raspoložive resurse.
Upotreba informacija: U slučaju potpunog ili delimičnog preuzimanja i daljeg korišćenja materijala koji se nalazi na sajtu, potrebno je navesti link odgovarajuće stranice na sajtu kompanije TeleTrade-a kao izvora informacija. Upotreba materijala na internetu mora biti praćena hiper linkom do web stranice teletrade.org. Automatski uvoz materijala i informacija sa stranice je zabranjen.
Ako imate bilo kakvih pitanja, obratite nam se pr@teletrade.global.
транcфери