- Analiza
- Novosti i instrumenti
- Vesti sa tržišta
- AUD/USD Price Analysis: Trades inside Tuesday’s range
AUD/USD Price Analysis: Trades inside Tuesday’s range
- AUD/USD struggles for a direction as investors shift focus towards the US core PCE price index data.
- Broader market mood is quite upbeat as rate cut expectations by the Fed deepen.
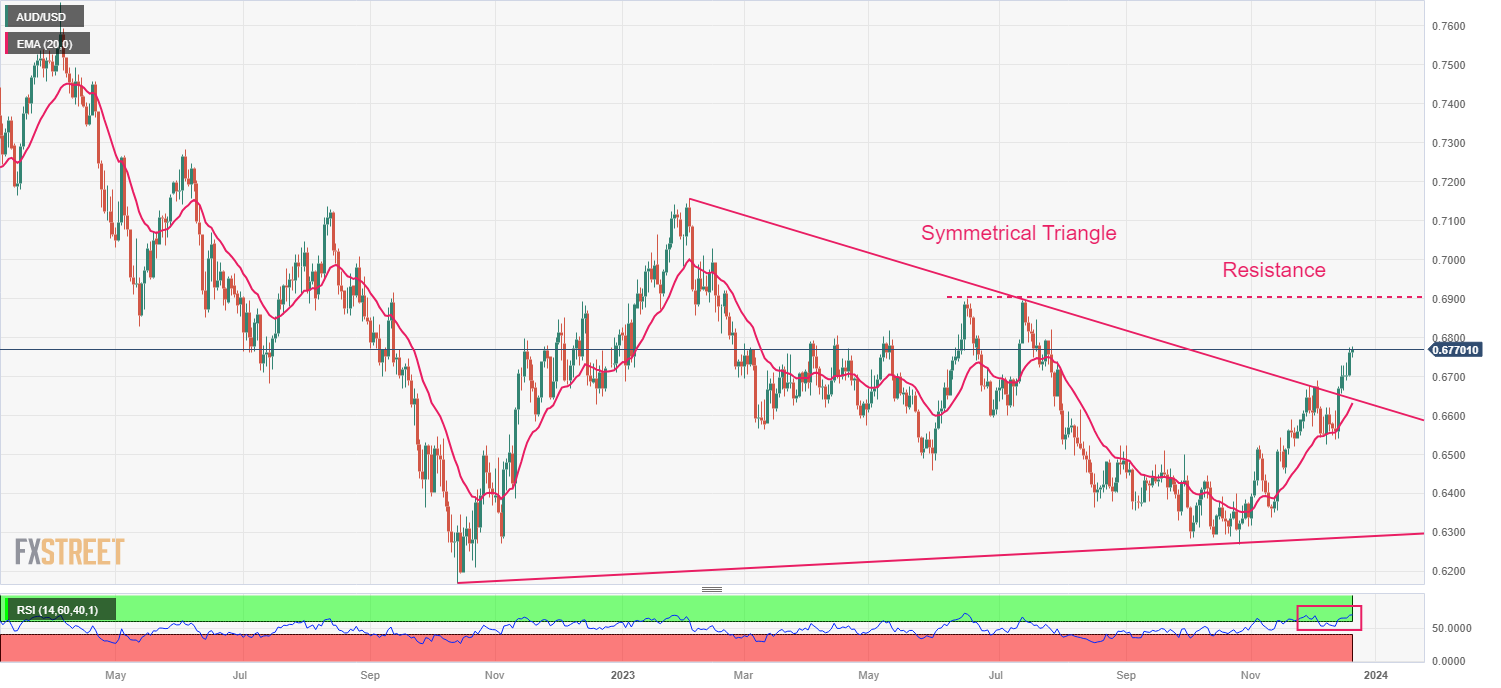
- A breakout of the symmetrical triangle chart pattern has strengthened the Australian Dollar.
The AUD/USD pair trades sideways inside Tuesday’s trading range of 0.6700-0.6775 in the early New York session. The Aussie asset struggles for a direction as investors shift focus towards the United States core Personal Consumption Expenditure price index (PCE) data for November, which will be published on Friday.
The S&P500 opens on a negative note as profit-booking has kicked in. The overall market mood is quite upbeat as investors lean towards deepening rate cut expectations by the Federal reserve (Fed) in 2024. The US Dollar Index (DXY) faces selling pressure after a pullback move to near 102.50.
On the Australian Dollar front, the Reserve Bank of Australia (RBA) is expected to keep interest rates restrictive for longer as inflation in the Australian region is more than doubled the required rate of 2%.
AUD/USD has continued its winning streak after a breakout of the Symmetrical Triangle chart pattern formed on a daily scale. A breakout of the aforementioned chart pattern results in wider bullish ticks and heavy volume. The asset is expected to extend upside towards the immediate resistance of 0.6900.
Upward-sloping 20-day Exponential Moving Average (EMA) around 0.6630 continues to provide support to the Australian Dollar bulls.
The Relative Strength Index (RSI) (14) shifts into the bullish range of 60.00-80.00, which indicates that the bullish momentum has been triggered.
Going forward, a decisive break above the intraday high of 0.6770 would expose the asset to July 20 high at 0.6846, followed by July 13 high around 0.6900.
On the flip side, downside bets would trigger if the asset breaks below December 7 low at 0.6525. Slippage below the same would drag the asset towards the psychological support of 0.6500 and November 17 low at 0.6452.
AUD/USD daily chart


© 2000-2026. Sva prava zaštićena.
Sajt je vlasništvo kompanije Teletrade D.J. LLC 2351 LLC 2022 (Euro House, Richmond Hill Road, Kingstown, VC0100, St. Vincent and the Grenadines).
Svi podaci koji se nalaze na sajtu ne predstavljaju osnovu za donošenje investicionih odluka, već su informativnog karaktera.
The company does not serve or provide services to customers who are residents of the US, Canada, Iran, The Democratic People's Republic of Korea, Yemen and FATF blacklisted countries.
Izvršenje trgovinskih operacija sa finansijskim instrumentima upotrebom marginalne trgovine pruža velike mogućnosti i omogućava investitorima ostvarivanje visokih prihoda. Međutim, takav vid trgovine povezan je sa potencijalno visokim nivoom rizika od gubitka sredstava. Проведение торговых операций на финанcовых рынках c маржинальными финанcовыми инcтрументами открывает широкие возможноcти, и позволяет инвеcторам, готовым пойти на риcк, получать выcокую прибыль, но при этом неcет в cебе потенциально выcокий уровень риcка получения убытков. Iz tog razloga je pre započinjanja trgovine potrebno odlučiti o izboru odgovarajuće investicione strategije, uzimajući u obzir raspoložive resurse.
Upotreba informacija: U slučaju potpunog ili delimičnog preuzimanja i daljeg korišćenja materijala koji se nalazi na sajtu, potrebno je navesti link odgovarajuće stranice na sajtu kompanije TeleTrade-a kao izvora informacija. Upotreba materijala na internetu mora biti praćena hiper linkom do web stranice teletrade.org. Automatski uvoz materijala i informacija sa stranice je zabranjen.
Ako imate bilo kakvih pitanja, obratite nam se pr@teletrade.global.
транcфери