- Analiza
- Novosti i instrumenti
- Vesti sa tržišta
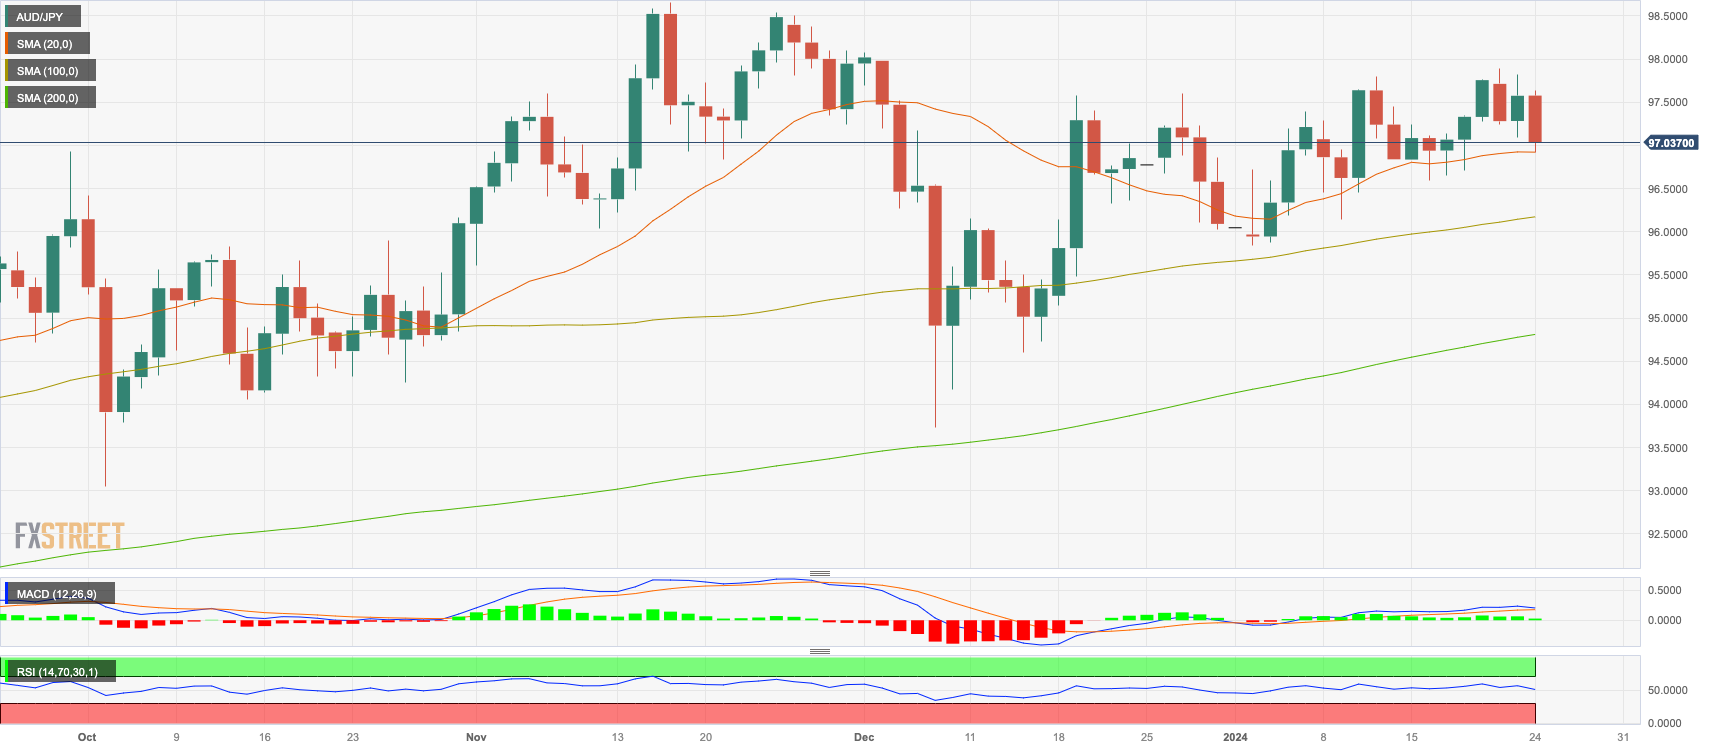
- AUD/JPY Price Analysis: Bears advances after S&P PMIs, BoJ decision
AUD/JPY Price Analysis: Bears advances after S&P PMIs, BoJ decision
- AUD/JPY trades at 97.12 with 0.40% losses.
- Daily chart indicators reveal sellers hold the momentum, in the immediate short term.
- Australian S&P PMIs were weak in January while the Japanese indexes were positive.
On Wednesday's session, the AUD/JPY finds itself trading near the 97.12 mark, registering a 0.45% decline. The currency pair's daily chart portrays a neutral to bearish outlook, with bears slowly gaining control. Meanwhile, signs of a negative stance are more pronounced as we glance at the four-hour chart. In that sense, the sellers recently gained ground on the back of the Bank of Japan’s hints on a potential pivot and positive economic figures from Japan.
In that sense, the Australian economy, as indicated by the preliminary S&P January PMIs, seems to be on a sluggish note, as the composite PMI has been below 50 for four consecutive months. On the other hand, the Japanese economy appears to be resilient with firm January PMIs across both manufacturing and services, in addition to robust December trade data. Moreover, the JPY seems to be finding demand as the expectations for the BoJ have shifted towards a potential rate increase around mid-year, as on Tuesday’s decision, Governor Ueda hinted that inflation seems to be aligning with the bank’s goal.
AUD/JPY daily chart
The indicators on the daily chart are currently portraying a diverse scenario. With the Relative Strength Index (RSI) in positive territory yet on a downward slope, there is an indication of weakening bullish momentum. Furthermore, diminishing green bars in the Moving Average Convergence Divergence (MACD) histogram reinforce this interpretation. However, the positioning above the essential Simple Moving Averages (SMAs) of 20, 100, and 200-day averages, acknowledge the dominant control of buyers over the extended trend.
A negative outlook is more pronounced on the four-hour charts. Here, the declining slope of the RSI reveals a strong bearish undercurrent, already in negative territory aligning with the falling green bars of the MACD.
AUD/JPY daily chart


© 2000-2026. Sva prava zaštićena.
Sajt je vlasništvo kompanije Teletrade D.J. LLC 2351 LLC 2022 (Euro House, Richmond Hill Road, Kingstown, VC0100, St. Vincent and the Grenadines).
Svi podaci koji se nalaze na sajtu ne predstavljaju osnovu za donošenje investicionih odluka, već su informativnog karaktera.
The company does not serve or provide services to customers who are residents of the US, Canada, Iran, The Democratic People's Republic of Korea, Yemen and FATF blacklisted countries.
Izvršenje trgovinskih operacija sa finansijskim instrumentima upotrebom marginalne trgovine pruža velike mogućnosti i omogućava investitorima ostvarivanje visokih prihoda. Međutim, takav vid trgovine povezan je sa potencijalno visokim nivoom rizika od gubitka sredstava. Проведение торговых операций на финанcовых рынках c маржинальными финанcовыми инcтрументами открывает широкие возможноcти, и позволяет инвеcторам, готовым пойти на риcк, получать выcокую прибыль, но при этом неcет в cебе потенциально выcокий уровень риcка получения убытков. Iz tog razloga je pre započinjanja trgovine potrebno odlučiti o izboru odgovarajuće investicione strategije, uzimajući u obzir raspoložive resurse.
Upotreba informacija: U slučaju potpunog ili delimičnog preuzimanja i daljeg korišćenja materijala koji se nalazi na sajtu, potrebno je navesti link odgovarajuće stranice na sajtu kompanije TeleTrade-a kao izvora informacija. Upotreba materijala na internetu mora biti praćena hiper linkom do web stranice teletrade.org. Automatski uvoz materijala i informacija sa stranice je zabranjen.
Ako imate bilo kakvih pitanja, obratite nam se pr@teletrade.global.
транcфери