- Analiza
- Novosti i instrumenti
- Vesti sa tržišta
- Gold Price Forecast: XAU/USD advances due to USD weakness, eyes on NFPs
Gold Price Forecast: XAU/USD advances due to USD weakness, eyes on NFPs
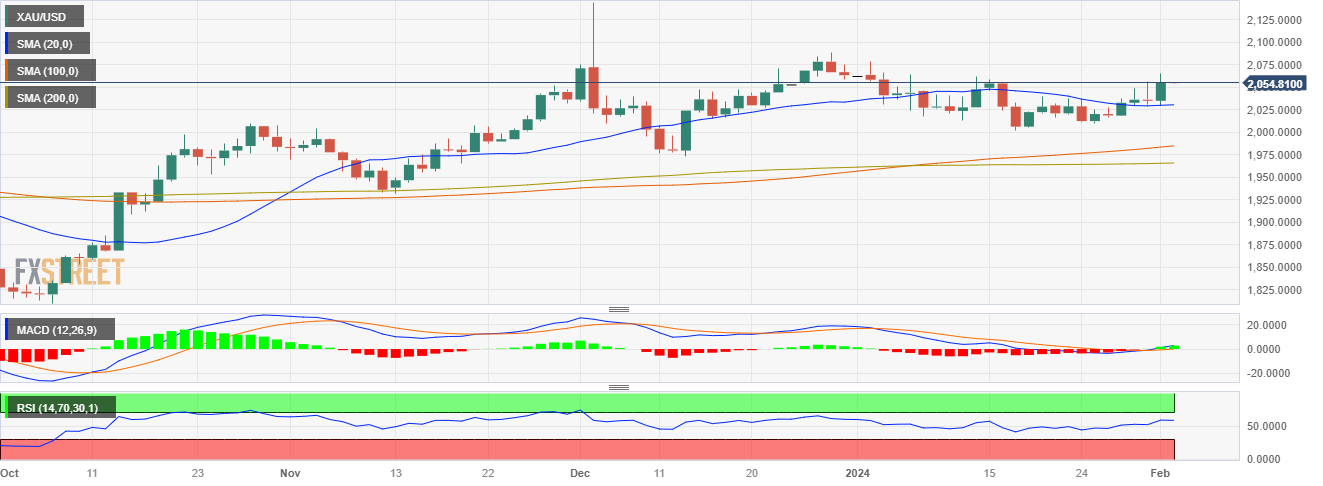
- The XAU/USD holds ground with bullish outlook at $2,055, showing a 0.78% rally.
- Weak Jobless Claims data weakened the USD during the session.
- Indicators stand near overbought conditions on the four-hour chart, a consolidation may be incoming.
In Thursday's session, the XAU/USD was spotted rallying to $2,055, depicting a bullish outlook on the daily chart with buyers gaining ground. The momentum is echoed in the four-hour chart, where indicators show a levelling near overbought conditions, suggesting potential market saturation. On the fundamental side, markets await key Nonfarm Payrolls figures from January due on Friday while higher-than-expected weekly Jobless Claims figures from the US weakened the Greenback during the session.
Federal Reserve’s Chair Powell considered not likely that the bank will reach a level of confidence by March to start easing. As a reaction, the US Dollar rallied on Wednesday as markets started to give up on the expectations of sooner cuts, but incoming data will ultimately guide the bank on the timing of the easing cycle. In case labor markets figures on Friday come in weak, the metal could see further upside, as the expectations on lower interest rates tend to benefit non-yielding assets.
XAU/USD daily chart
XAU/USD levels to watch
The daily chart indicators reflect a bullish momentum in the market. With a positive slope in the Relative Strength Index (RSI) and increasing green bars in the Moving Average Convergence Divergence (MACD), it signifies a rising trend and an ongoing domination by the buyers. Contributing to this bullish sentiment, the asset's position above the 20, 100, and 200-day Simple Moving Averages (SMAs) reinforces the current control held by the bulls.
Switching to a shorter timeframe view based on a four-hour chart, the indicators appear to flatten, with the RSI approaching the overbought territory, indicating a slowing momentum which is typical in highly bought situations. However, nearing the 70 threshold, it could signify a potential reversal as buyers might start taking profits, slowing the incoming buying force.


© 2000-2026. Sva prava zaštićena.
Sajt je vlasništvo kompanije Teletrade D.J. LLC 2351 LLC 2022 (Euro House, Richmond Hill Road, Kingstown, VC0100, St. Vincent and the Grenadines).
Svi podaci koji se nalaze na sajtu ne predstavljaju osnovu za donošenje investicionih odluka, već su informativnog karaktera.
The company does not serve or provide services to customers who are residents of the US, Canada, Iran, The Democratic People's Republic of Korea, Yemen and FATF blacklisted countries.
Izvršenje trgovinskih operacija sa finansijskim instrumentima upotrebom marginalne trgovine pruža velike mogućnosti i omogućava investitorima ostvarivanje visokih prihoda. Međutim, takav vid trgovine povezan je sa potencijalno visokim nivoom rizika od gubitka sredstava. Проведение торговых операций на финанcовых рынках c маржинальными финанcовыми инcтрументами открывает широкие возможноcти, и позволяет инвеcторам, готовым пойти на риcк, получать выcокую прибыль, но при этом неcет в cебе потенциально выcокий уровень риcка получения убытков. Iz tog razloga je pre započinjanja trgovine potrebno odlučiti o izboru odgovarajuće investicione strategije, uzimajući u obzir raspoložive resurse.
Upotreba informacija: U slučaju potpunog ili delimičnog preuzimanja i daljeg korišćenja materijala koji se nalazi na sajtu, potrebno je navesti link odgovarajuće stranice na sajtu kompanije TeleTrade-a kao izvora informacija. Upotreba materijala na internetu mora biti praćena hiper linkom do web stranice teletrade.org. Automatski uvoz materijala i informacija sa stranice je zabranjen.
Ako imate bilo kakvih pitanja, obratite nam se pr@teletrade.global.
транcфери