- Analiza
- Novosti i instrumenti
- Vesti sa tržišta
- NZD/USD faces strong downward force amid surprising strong NFP figures
NZD/USD faces strong downward force amid surprising strong NFP figures
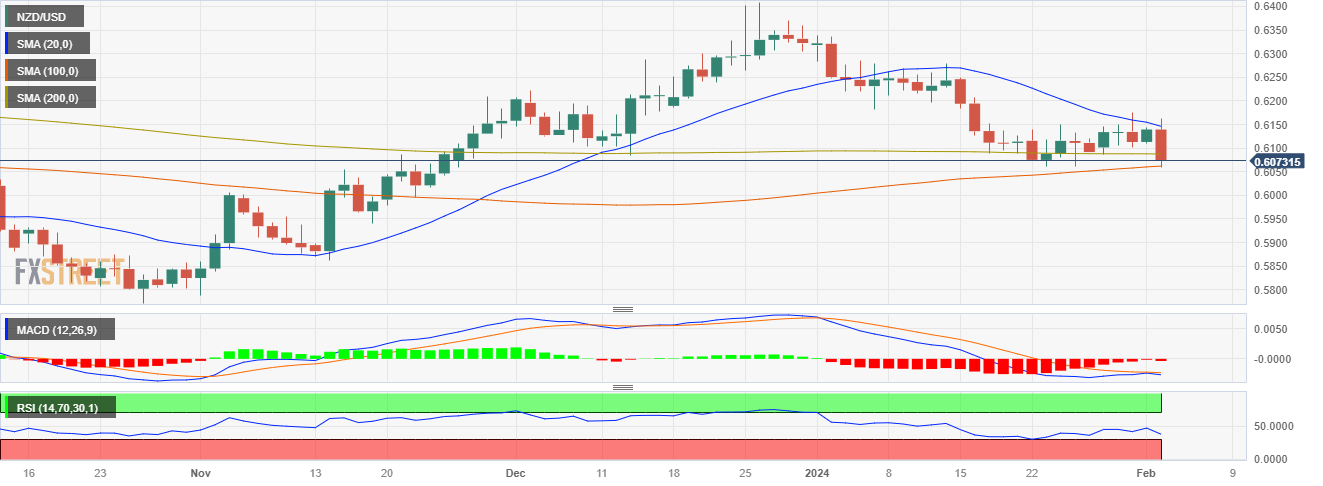
- The NZD/USD showed a strong downward swing, falling near the 0.6060 level.
- US Nonfarm Payrolls added 353K jobs in January surpassing by a wide margin the expectations.
- The bets of a rate cut in March sharply declined and markets pushed the start of the easing to May.
In Friday's trading session, the NZD/USD took a steep turn downwards, landing at a rough level of 0.6060. The pronounced downward trajectory resulted from a surprisingly strong US Nonfarm Payrolls report that pushed the pair into bearish domain as markets gave up the hopes of sooner rate cuts by the Federal Reserve (Fed). For the week, the pair closed a 0.40% weekly loss.
The US Bureau of Labor Statistics reported that the Nonfarm Payrolls for January presented a robust picture with a significant increase of 353K compared to the consensus figure of 180K and the previous 333K. The Average Hourly Earnings in January increased by 0.6%, outstripping the anticipated 0.3% and the preceding 0.4% respectively while the yearly measure soared to a 4.5%, higher than the prior 4.4% and beating the expected 4.1%. Lastly, the Unemployment Rate for January remained steady at 3.7%, which aligns with its previous figure and was slightly lower than the anticipated 3.8%.
As a reaction, the US bond rose across the board as markets start to prepare for the easing cycle of the Fed to start in May rather than in March. The 2-year rate is currently standing at 4.37%, with the 5 and 10-year yields observed at 4% and 4.05% respectively. As per historical financial trends, a rise in yields generally tends to fortify the USD's position as it is more appealling for foreign investors.
In line with that, the CME FedWatch Tool showed a significant drop in the likelihood of a March interest rate cut, with estimates now standing at just 20% while the odds of a cut in the following May meeting rose to nearly 58%.
NZD/USD levels to watch
The daily chart suggests that the pair has a bearish bias, at least in the short-term. Indicators signal declining buying power, as depicted by the negative slope and negative territory in the Relative Strength Index (RSI). Adding to that the histogram of the Moving Average Convergence Divergence (MACD) displays rising red bars, hinting that the overall momentum favors the sellers.
Looking at the pair's position relative to moving averages, it is trading below the 20-day and 200-day Simple Moving Averages (SMAs), another sign of bearish sentiment. Yet, interestingly, it sits above the 100-day SMA, indicating that the bulls are maintaining a bullish grip on the broader outlook.


© 2000-2026. Sva prava zaštićena.
Sajt je vlasništvo kompanije Teletrade D.J. LLC 2351 LLC 2022 (Euro House, Richmond Hill Road, Kingstown, VC0100, St. Vincent and the Grenadines).
Svi podaci koji se nalaze na sajtu ne predstavljaju osnovu za donošenje investicionih odluka, već su informativnog karaktera.
The company does not serve or provide services to customers who are residents of the US, Canada, Iran, The Democratic People's Republic of Korea, Yemen and FATF blacklisted countries.
Izvršenje trgovinskih operacija sa finansijskim instrumentima upotrebom marginalne trgovine pruža velike mogućnosti i omogućava investitorima ostvarivanje visokih prihoda. Međutim, takav vid trgovine povezan je sa potencijalno visokim nivoom rizika od gubitka sredstava. Проведение торговых операций на финанcовых рынках c маржинальными финанcовыми инcтрументами открывает широкие возможноcти, и позволяет инвеcторам, готовым пойти на риcк, получать выcокую прибыль, но при этом неcет в cебе потенциально выcокий уровень риcка получения убытков. Iz tog razloga je pre započinjanja trgovine potrebno odlučiti o izboru odgovarajuće investicione strategije, uzimajući u obzir raspoložive resurse.
Upotreba informacija: U slučaju potpunog ili delimičnog preuzimanja i daljeg korišćenja materijala koji se nalazi na sajtu, potrebno je navesti link odgovarajuće stranice na sajtu kompanije TeleTrade-a kao izvora informacija. Upotreba materijala na internetu mora biti praćena hiper linkom do web stranice teletrade.org. Automatski uvoz materijala i informacija sa stranice je zabranjen.
Ako imate bilo kakvih pitanja, obratite nam se pr@teletrade.global.
транcфери