- Analiza
- Novosti i instrumenti
- Vesti sa tržišta
- EUR/GBP threatens the 20-day SMA after European PMIs
EUR/GBP threatens the 20-day SMA after European PMIs
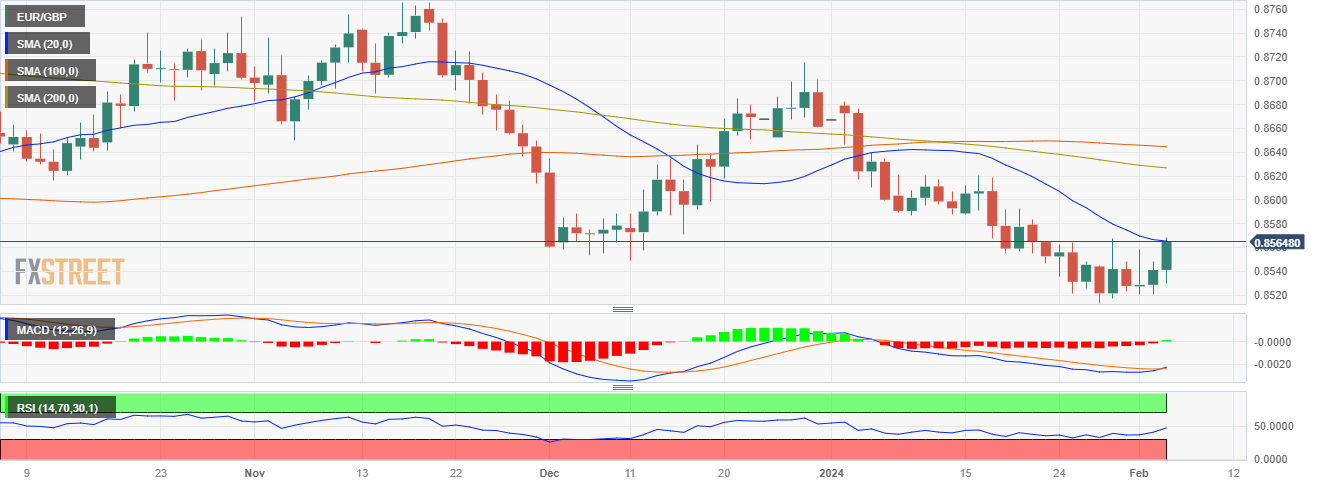
- The EUR/GBP stands at 0.8560, marking a 0.25% increase in the session.
- European PMIs from January where upwards revised but remained still in contraction territory.
- Hourly indicators hint at potential consolidation after bulls got rejected near overbought area.
In Monday's session, the EUR/GBP pair was seen trading at 0.8560, gaining a 0.25% and seems to be marching towards the 20-day Simple Moving Average (SMA) at 0.8565 . Despite pressures from a stagnant Euro Area economy and anticipations of ECB's rate cut, the daily chart indicates the dominance of buyers. On the hourly chart, however, indicators hint at a possible pullback as they got rejected near the overbought territory.
During the European session, the Hamburg Commercial Bank (HCOB) PMIs from January where upwards revised which gave some traction to the EUR but they still remain deep in contraction area. This situation may push the ECB to initiate a rate cut by June 2024, assuming the economies continue to weaken. Conversely, the UK economy shows signs of potential firmness with the Bank of England (BoE) shifting from assessing the need for restrictive monetary policy to sustaining the current stance. Following the bank's decision to hold rates, market anticipates around 100 bps of rate cuts for 2024, which might be moderated due to expected fiscal amendments. On the ECB side, markets expect between 125 and 150 bps of easing in 2024 and this divergences may eventually limit any upwards movements by the cross.
EUR/GBP levels to watch
Assessing the daily chart indicators, the Relative Strength Index (RSI) is glimpsing a positive gradient despite being within negative territory. This exhibits a potential shift towards an upward trend as bulls start to conquer additional ground. In addition, the Moving Average Convergence Divergence (MACD) is exhibiting increased green bars, suggesting that the upward force is taking control. The shift in momentum may come into fruition in case the buyers manage to push the pair back above the 20-day Simple Moving Average (SMA) .
Switching to the hourly chart for the more immediate perspective, the scenario seems to be a bit more complicated for the bulls. Even though indicators have been rebuffed near overbought territory, the RSI portrays a downward slope positioned within positive territory, indicating some selling momentum as buyers seem to be taking profits. However, the sustained growth in the green bars of the MACD identifies a continuous buying pressure in the shorter timeframe.
EUR/GBP daily chart


© 2000-2026. Sva prava zaštićena.
Sajt je vlasništvo kompanije Teletrade D.J. LLC 2351 LLC 2022 (Euro House, Richmond Hill Road, Kingstown, VC0100, St. Vincent and the Grenadines).
Svi podaci koji se nalaze na sajtu ne predstavljaju osnovu za donošenje investicionih odluka, već su informativnog karaktera.
The company does not serve or provide services to customers who are residents of the US, Canada, Iran, The Democratic People's Republic of Korea, Yemen and FATF blacklisted countries.
Izvršenje trgovinskih operacija sa finansijskim instrumentima upotrebom marginalne trgovine pruža velike mogućnosti i omogućava investitorima ostvarivanje visokih prihoda. Međutim, takav vid trgovine povezan je sa potencijalno visokim nivoom rizika od gubitka sredstava. Проведение торговых операций на финанcовых рынках c маржинальными финанcовыми инcтрументами открывает широкие возможноcти, и позволяет инвеcторам, готовым пойти на риcк, получать выcокую прибыль, но при этом неcет в cебе потенциально выcокий уровень риcка получения убытков. Iz tog razloga je pre započinjanja trgovine potrebno odlučiti o izboru odgovarajuće investicione strategije, uzimajući u obzir raspoložive resurse.
Upotreba informacija: U slučaju potpunog ili delimičnog preuzimanja i daljeg korišćenja materijala koji se nalazi na sajtu, potrebno je navesti link odgovarajuće stranice na sajtu kompanije TeleTrade-a kao izvora informacija. Upotreba materijala na internetu mora biti praćena hiper linkom do web stranice teletrade.org. Automatski uvoz materijala i informacija sa stranice je zabranjen.
Ako imate bilo kakvih pitanja, obratite nam se pr@teletrade.global.
транcфери