- Analiza
- Novosti i instrumenti
- Vesti sa tržišta
- EUR/USD hints at weakness to come
EUR/USD hints at weakness to come
- EUR/USD is trading quietly prior to the major key US inflation data release on Tuesday.
- US CPI data is likely to shape expectations of when the Federal Reserve will start to cut interest rates – a US Dollar driver.
- There are technical signs the pair may be about to correct further, although the short-term trend remains bullish.
EUR/USD is trading in the 1.0940s on Monday during the early European session as traders await the next big data release for the pair, US Consumer Price Index (CPI) inflation data out on Tuesday, at 13:30 GMT.
The CPI report is seen as a key factor in deciding when the US Federal Reserve (Fed) will decide to start cutting interest rates. If inflation falls lower than expected, then it could bring forward the moment when the Fed pivots. Lower interest rates would be negative for the US Dollar (USD) all other things being equal, as they attract lower inflows of foreign capital.
Daily digest market movers: EUR/USD awaits inflation data
- EUR/USD is trading in the mid 1.0900s as traders await the release of US CPI data for February.
- The Consumer Price Index ex Food and Energy is forecast to moderate to 3.7% YoY – from 3.9% previously, and 0.3% MoM from 0.4% previously.
- The headline CPI figure is forecast to come in at 3.1% YoY, unchanged from the previous month, and at 0.4% MoM from 0.3% in the previous month.
- According to the CME FedWatch Tool, which calculates a market-based expectation of when the Federal Reserve will begin reducing its Fed Funds Rate, the probability of a first cut in March is 4%, in May 31.5%, and the chances of a cut by June are 73.8%.
- EUR/USD saw a volatile end to last week after US Nonfarm Payrolls (NFP) data painted a mixed picture of the US labor market.
- Although the headline NFP figure beat estimates, the previous figure was revised down from 353K to 229K, Average Hourly Earnings – a key factor in inflation – came out lower than expected, and the Unemployment Rate rose from 3.7% to 3.9% when economists had forecast no-change.
- The result weighed on the US Dollar (USD) as it suggested an increased chance the Fed might reduce interest rates to avert a hard landing. This resulted in an upswing for EUR/USD to the 1.0970s.
- The pair failed to sustain the highs, however, as the Euro also weakened on reports that two key figures in the European Central Bank (ECB) had suggested the ECB might need to cut interest rates as soon as April.
- Banque de France President François Villeroy de Galhau and Bundesbank President Dr. Joachim Nagel, both said that a rate cut in the spring might now be warranted.
- This contrasted with the official line delivered by ECB President Christine Lagarde at her press conference after the meeting on Thursday, where she had earmarked June as the month when the ECB would review its policy on interest rates.
Technical Analysis: Euro overbought and pulling back
Turning to the charts, the overall short-term picture for EUR/USD is that the pair has been rising since February in an uptrend that continues to slightly favor bulls, but there are increasing signs a correction may be about to unfold.
The Relative Strength Indicator (RSI) has exited the overbought zone on the 4-hour chart, providing a sell signal. The RSI has also formed a pattern at the highs (circled), which resembles a Head and Shoulders reversal pattern. This reinforces the sell signal.
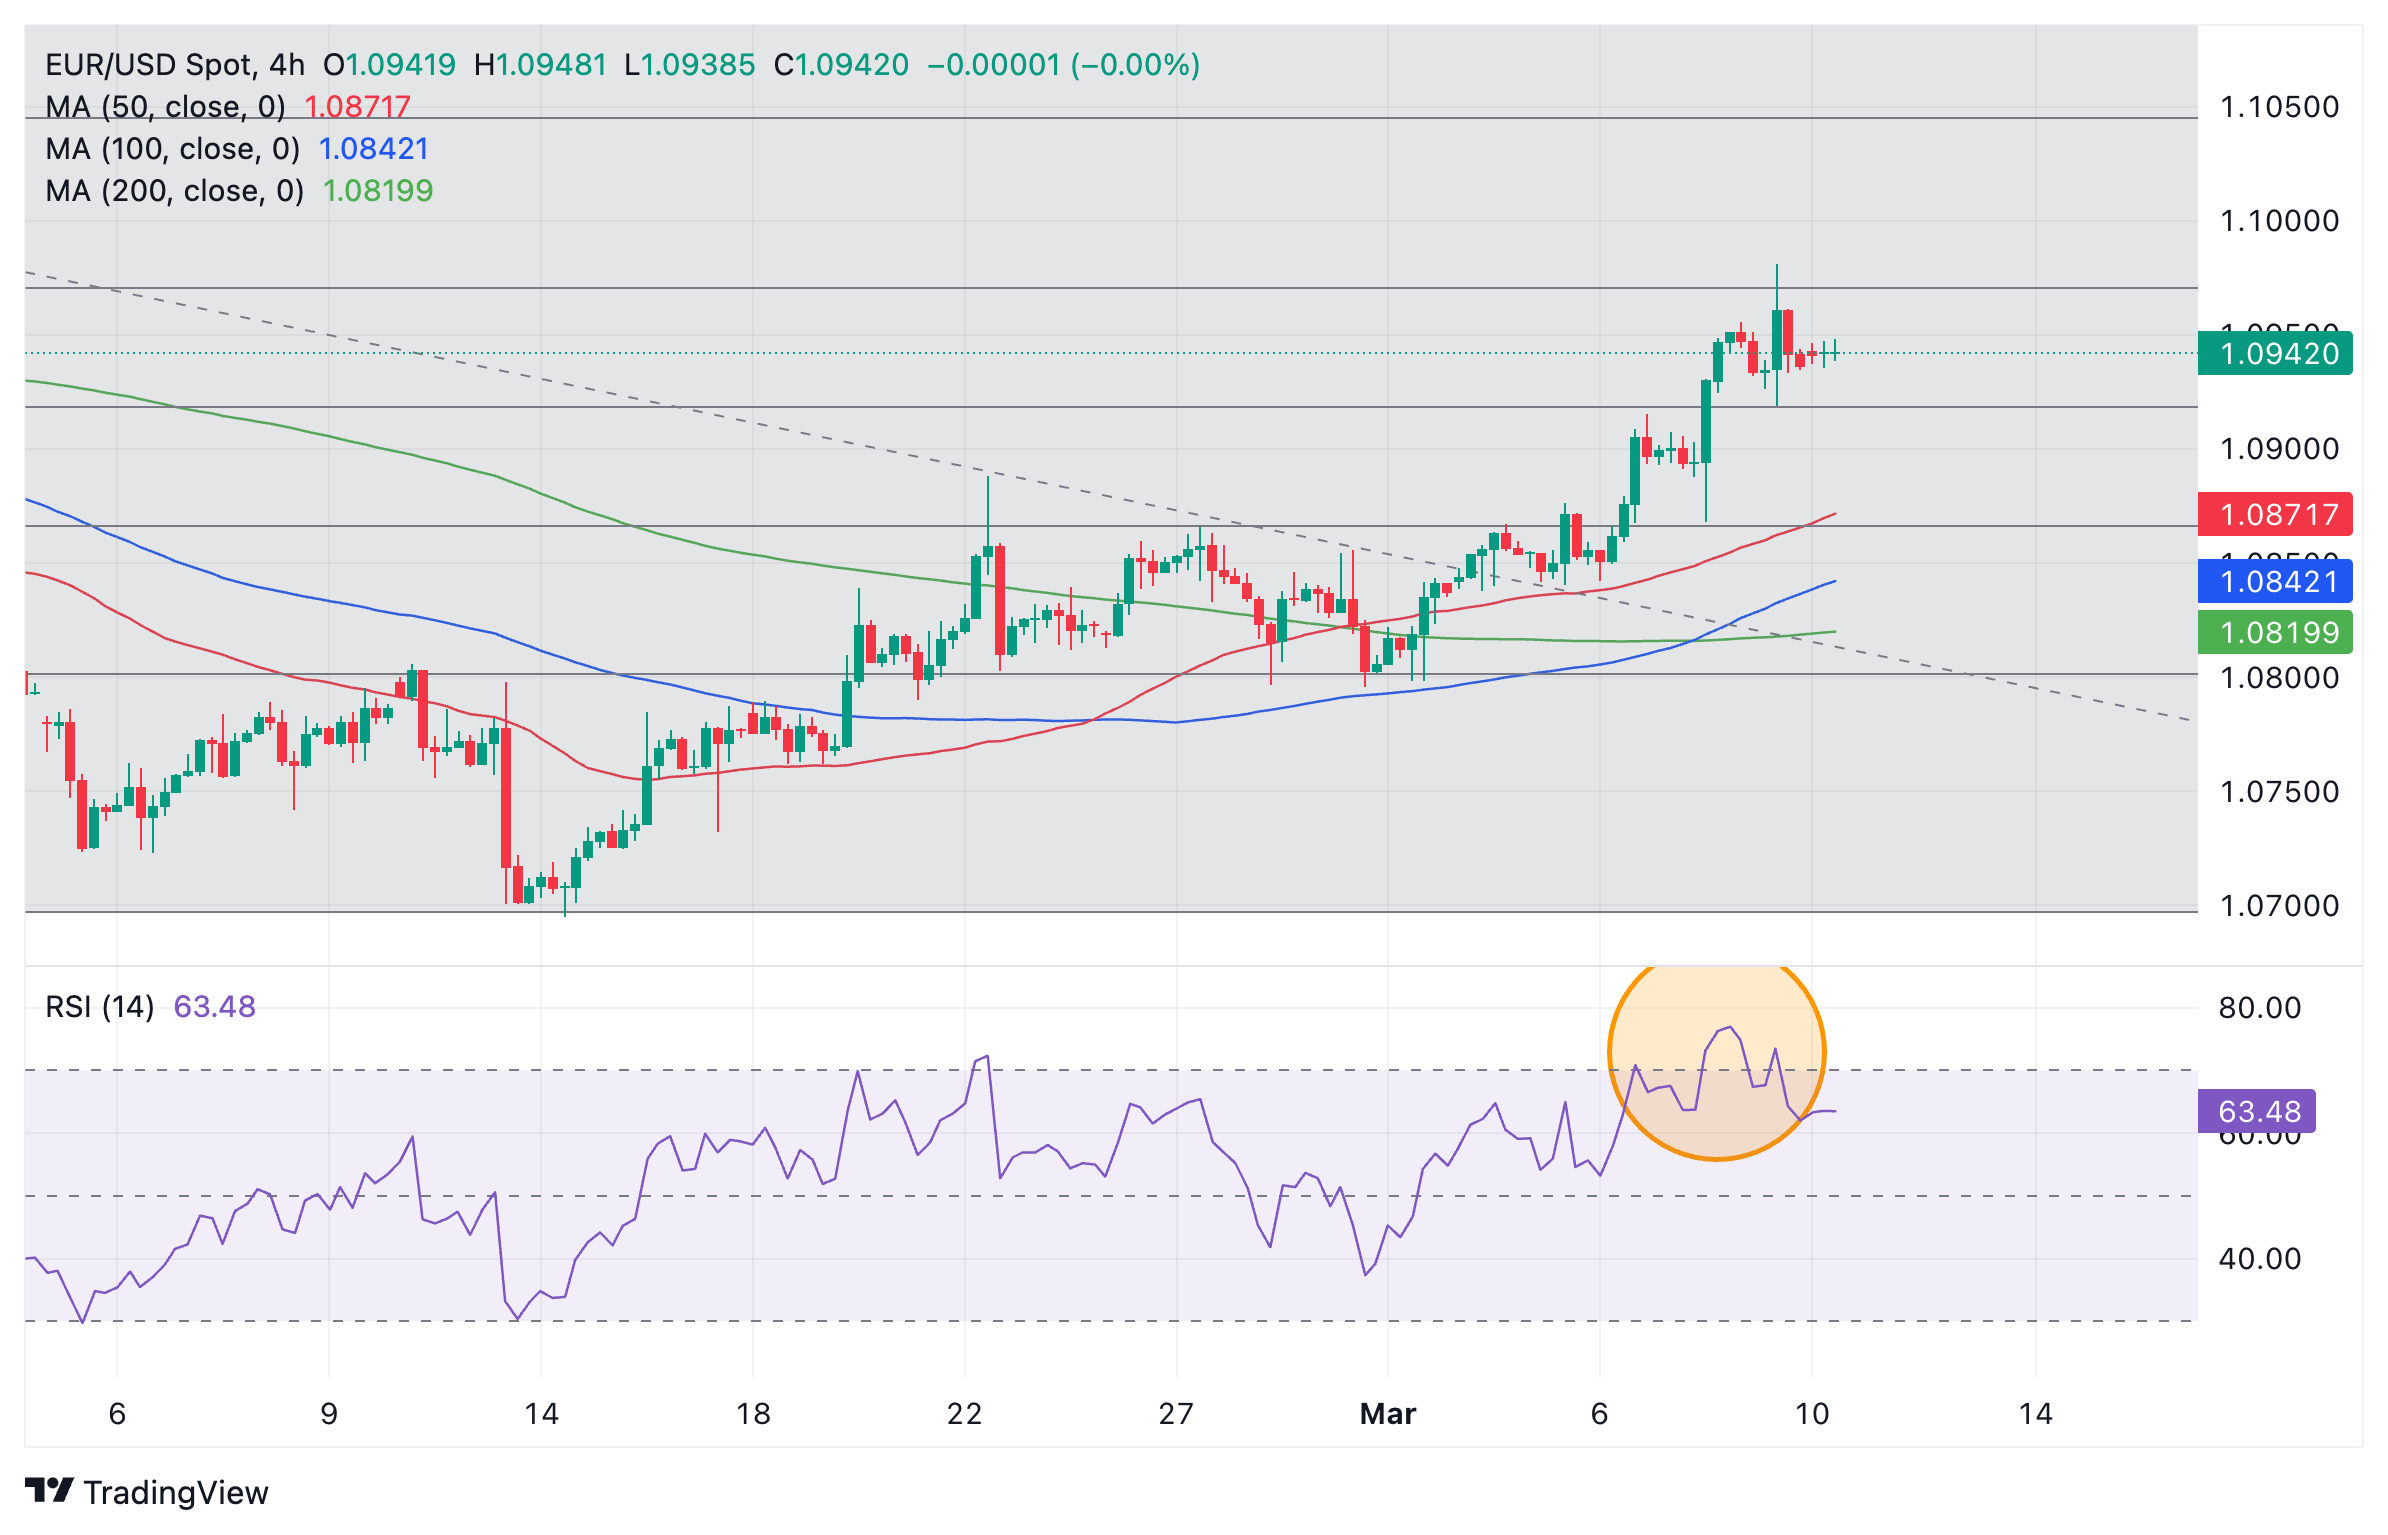
Euro vs US Dollar: 4-hour chart
The pair also seems to have completed a three-wave ABC measured move pattern, further suggesting a deeper correction is about to unfold.
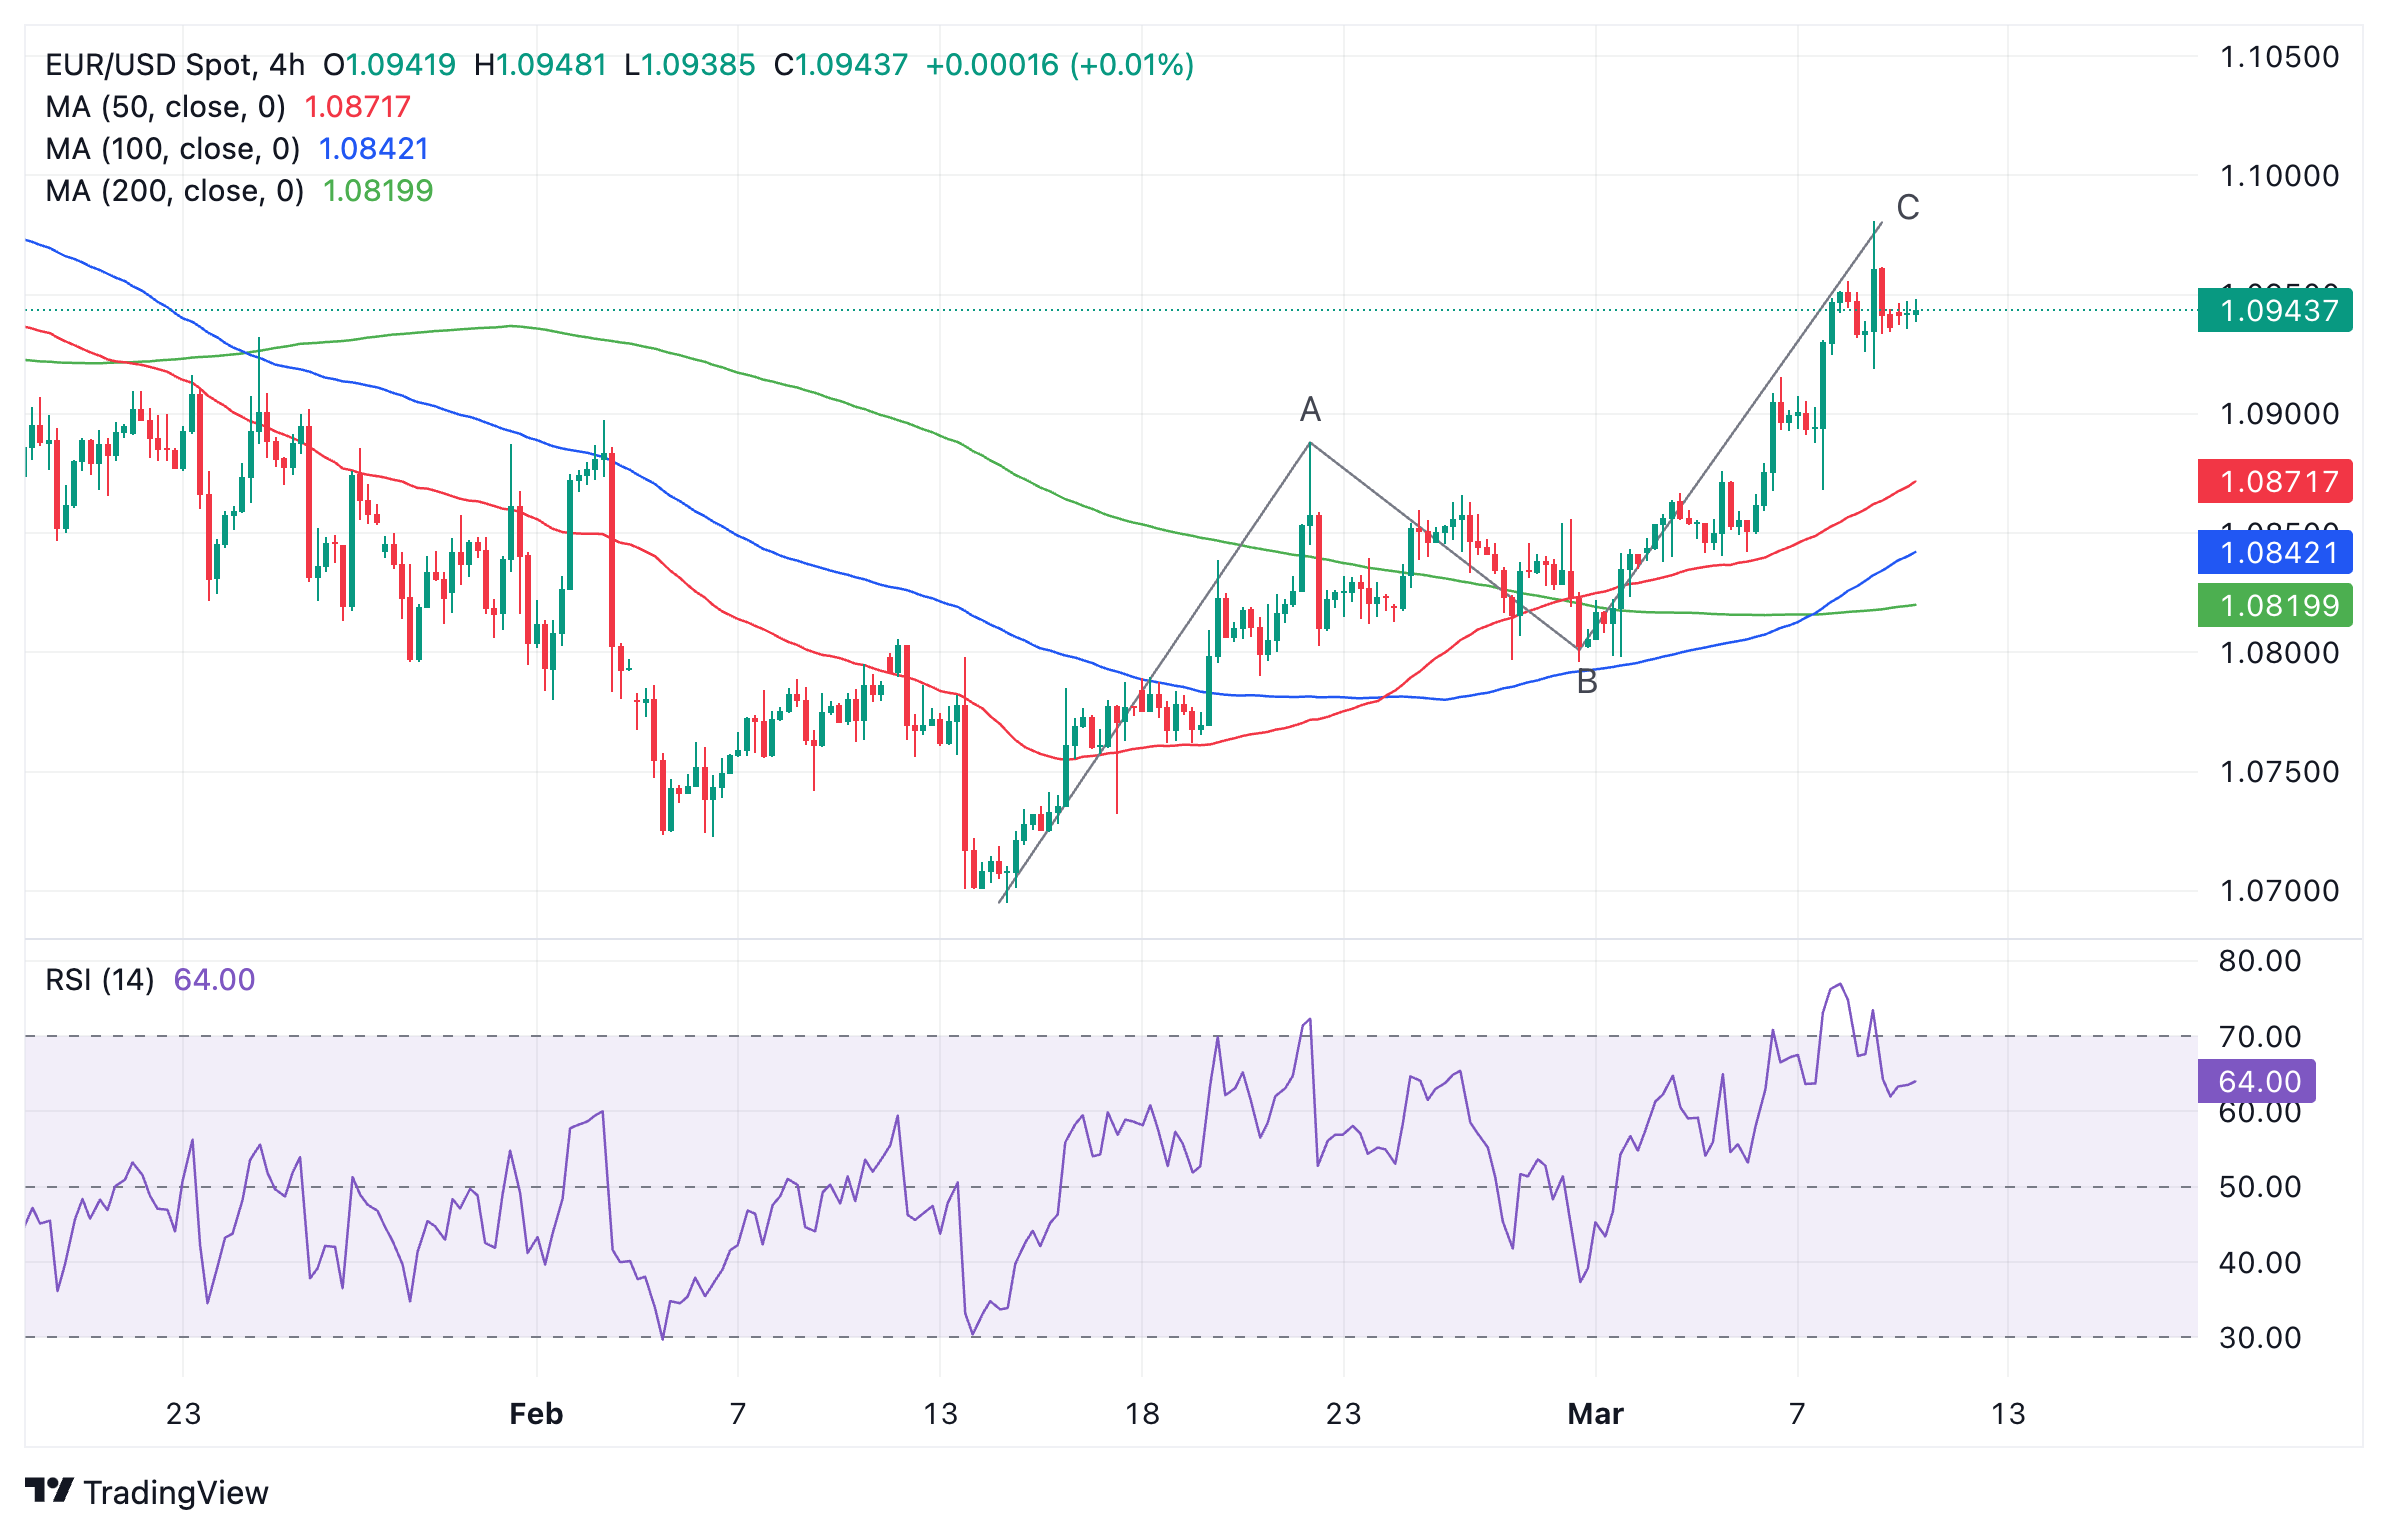
Euro vs US Dollar: 4-hour chart
One possible zone where the correction could find support is between the 1.0898 February 2 high and the top of the A wave at 1.0888.
The daily chart shows a bearish Shooting Star Japanese candlestick pattern (circled) has formed on Friday, March 8, after the NFP release. If this is followed up by another bearish day it will provide confirmation for a bearish short-term reversal signal.
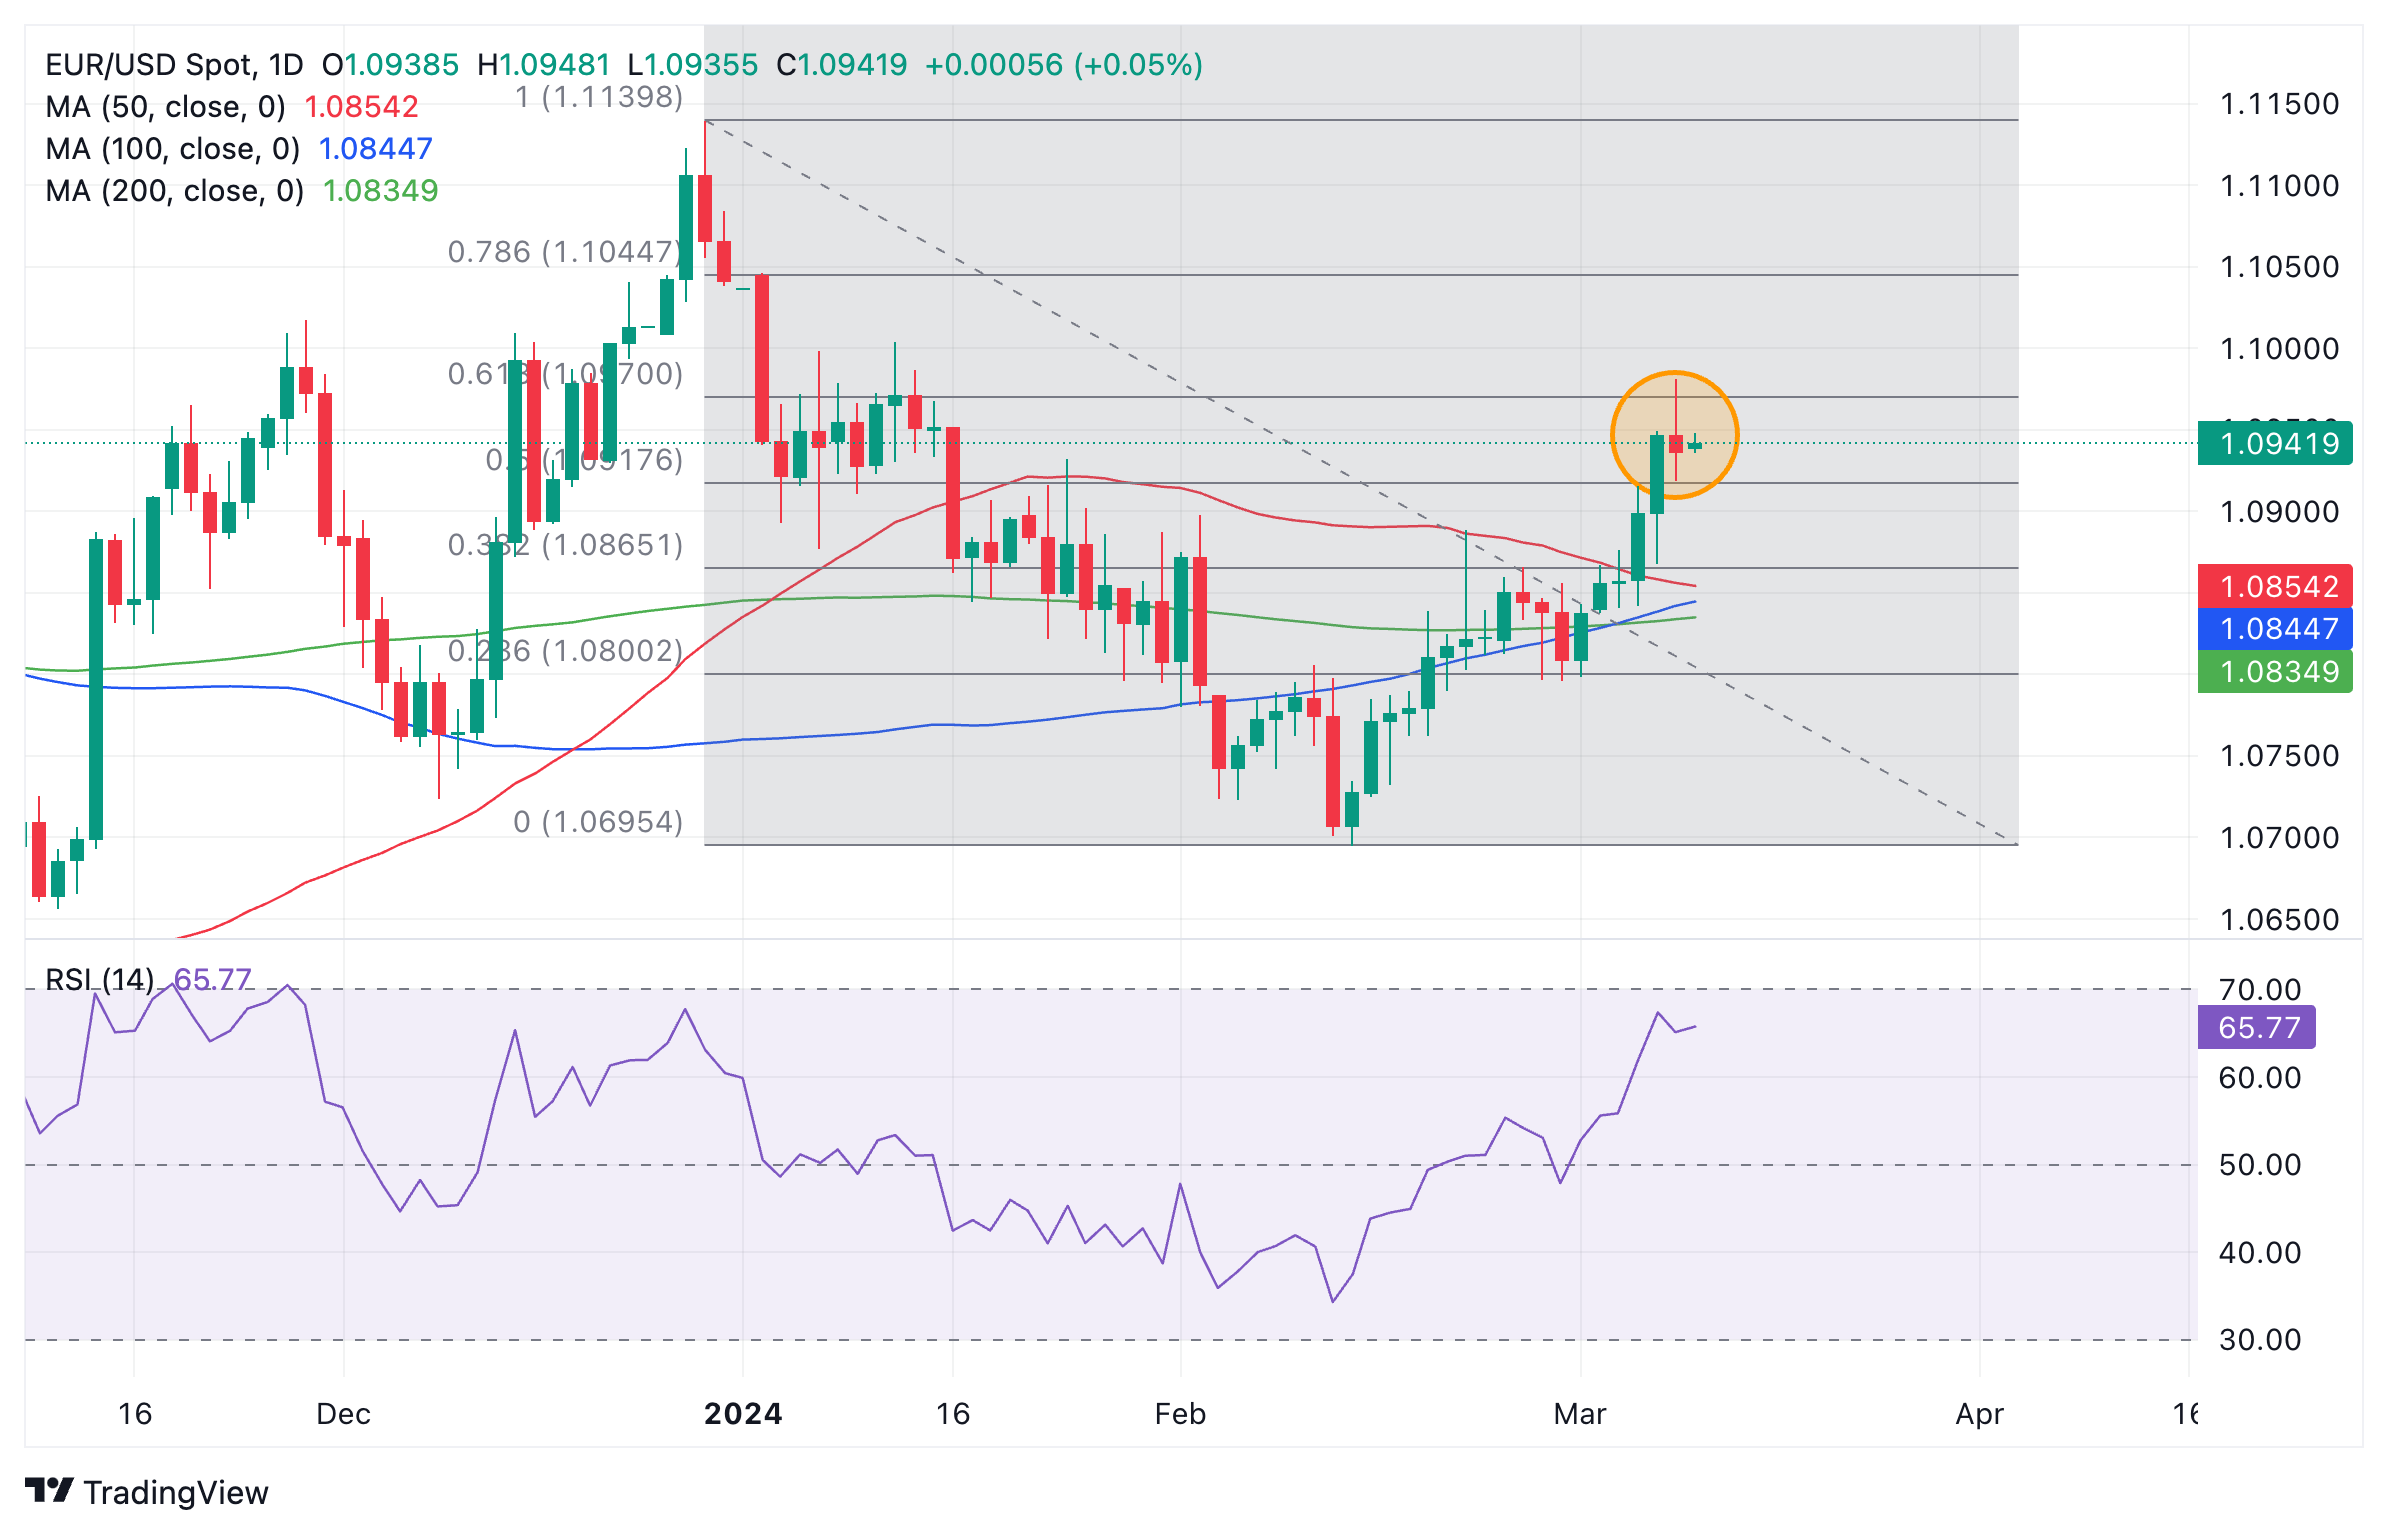
Euro vs US Dollar: 1-day chart
The completion of the Shooting Star also coincides with the key 0.618 Fibonacci retracement of the early 2024 decline, at 1.0972.
Despite all these bad omens, price itself stubbornly remains in the 1.0940s and it is still possible it could recover and run up to the next major target at 1.1000, simply extending the short-term trend higher. After that, 1.1043 comes into view, at the 0.786 Fibonacci retracement.
A break beneath the 1.0795 lows would indicate a vulnerability to a reversal of the short-term trend.
The overall long-term trend is sideways and difficult to forecast.


© 2000-2026. Sva prava zaštićena.
Sajt je vlasništvo kompanije Teletrade D.J. LLC 2351 LLC 2022 (Euro House, Richmond Hill Road, Kingstown, VC0100, St. Vincent and the Grenadines).
Svi podaci koji se nalaze na sajtu ne predstavljaju osnovu za donošenje investicionih odluka, već su informativnog karaktera.
The company does not serve or provide services to customers who are residents of the US, Canada, Iran, The Democratic People's Republic of Korea, Yemen and FATF blacklisted countries.
Izvršenje trgovinskih operacija sa finansijskim instrumentima upotrebom marginalne trgovine pruža velike mogućnosti i omogućava investitorima ostvarivanje visokih prihoda. Međutim, takav vid trgovine povezan je sa potencijalno visokim nivoom rizika od gubitka sredstava. Проведение торговых операций на финанcовых рынках c маржинальными финанcовыми инcтрументами открывает широкие возможноcти, и позволяет инвеcторам, готовым пойти на риcк, получать выcокую прибыль, но при этом неcет в cебе потенциально выcокий уровень риcка получения убытков. Iz tog razloga je pre započinjanja trgovine potrebno odlučiti o izboru odgovarajuće investicione strategije, uzimajući u obzir raspoložive resurse.
Upotreba informacija: U slučaju potpunog ili delimičnog preuzimanja i daljeg korišćenja materijala koji se nalazi na sajtu, potrebno je navesti link odgovarajuće stranice na sajtu kompanije TeleTrade-a kao izvora informacija. Upotreba materijala na internetu mora biti praćena hiper linkom do web stranice teletrade.org. Automatski uvoz materijala i informacija sa stranice je zabranjen.
Ako imate bilo kakvih pitanja, obratite nam se pr@teletrade.global.
транcфери