- Analiza
- Novosti i instrumenti
- Vesti sa tržišta
- EUR/GBP Price Analysis: Bearish sentiment prevails, daily and hourly trends lean negative
EUR/GBP Price Analysis: Bearish sentiment prevails, daily and hourly trends lean negative
- The daily chart reveals a mostly bearish environment with somewhat flat indicators.
- The hourly chart analysis depicts a potential bearish shift with the RSI reading close to the neutral-negative zone.
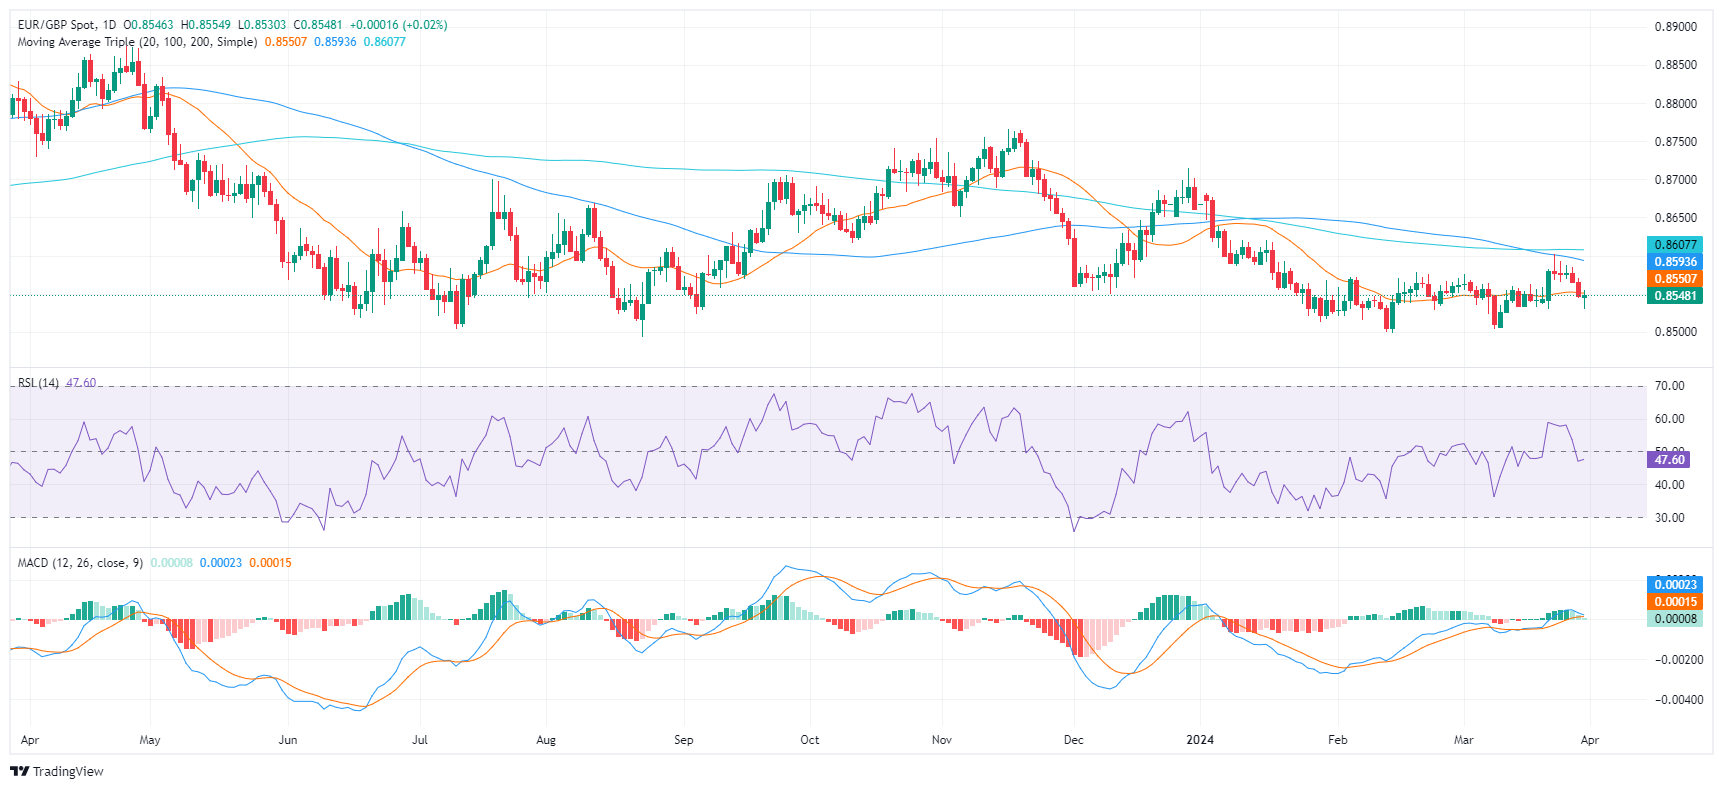
The EUR/GBP pair is currently trading at 0.8550, with minor losses on Friday’s session. The sellers are exerting their presence as bullish momentum remains weak and the fact that the cross remains below its main Simple Moving Averages (SMAs) of 20,100 and 200-days contributes to the bearish bias.
On the daily chart, the Relative Strength Index (RSI) currently resides in negative territory but stands flat while the Moving Average Convergence Divergence (MACD) prints neutral green bars, suggesting stagnant momentum. This demonstrates the trend might continue in the near term.
EUR/GBP daily chart
Moving to the hourly chart, the RSI shows a mixed trend with readings ranging from 33 and then recovering to 50 standing on the edge of the neutral-negative territory. Coupled with flat green bars on the MACD histogram, there might be a shift towards a bearish momentum after the bulls' short recovery during the European session.
EUR/GBP hourly chart
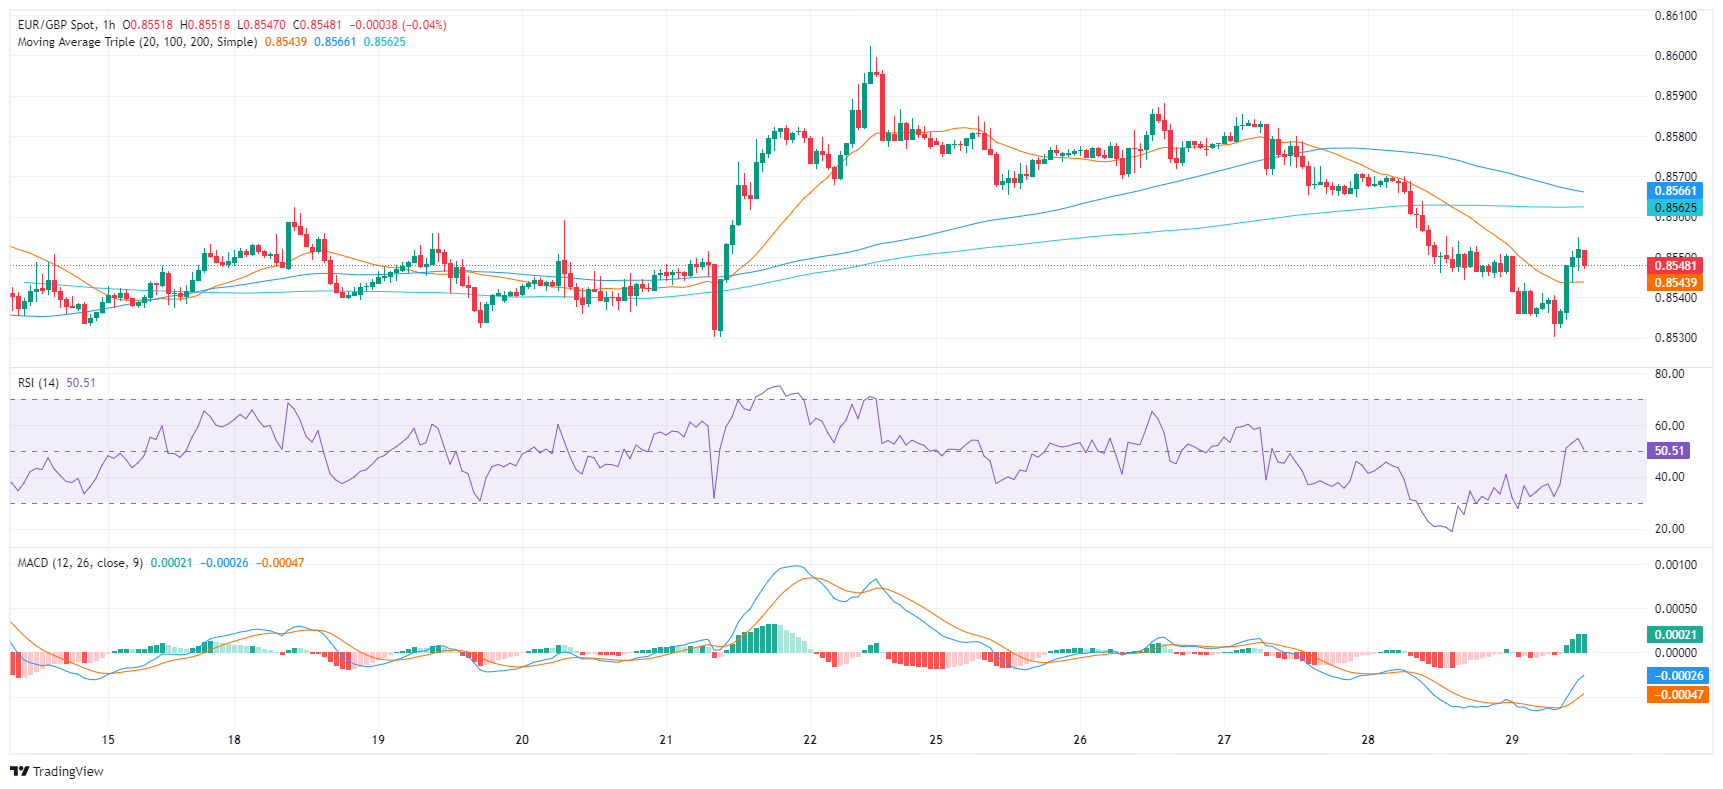
In conclusion, both the daily and hourly analyses point to a primarily negative trend for EUR/GBP, albeit with potential hourly fluctuations. If the buyers want to avoid losses they should reclaim the 200-day SMA around 0.8550 and build support around it.


© 2000-2026. Sva prava zaštićena.
Sajt je vlasništvo kompanije Teletrade D.J. LLC 2351 LLC 2022 (Euro House, Richmond Hill Road, Kingstown, VC0100, St. Vincent and the Grenadines).
Svi podaci koji se nalaze na sajtu ne predstavljaju osnovu za donošenje investicionih odluka, već su informativnog karaktera.
The company does not serve or provide services to customers who are residents of the US, Canada, Iran, The Democratic People's Republic of Korea, Yemen and FATF blacklisted countries.
Izvršenje trgovinskih operacija sa finansijskim instrumentima upotrebom marginalne trgovine pruža velike mogućnosti i omogućava investitorima ostvarivanje visokih prihoda. Međutim, takav vid trgovine povezan je sa potencijalno visokim nivoom rizika od gubitka sredstava. Проведение торговых операций на финанcовых рынках c маржинальными финанcовыми инcтрументами открывает широкие возможноcти, и позволяет инвеcторам, готовым пойти на риcк, получать выcокую прибыль, но при этом неcет в cебе потенциально выcокий уровень риcка получения убытков. Iz tog razloga je pre započinjanja trgovine potrebno odlučiti o izboru odgovarajuće investicione strategije, uzimajući u obzir raspoložive resurse.
Upotreba informacija: U slučaju potpunog ili delimičnog preuzimanja i daljeg korišćenja materijala koji se nalazi na sajtu, potrebno je navesti link odgovarajuće stranice na sajtu kompanije TeleTrade-a kao izvora informacija. Upotreba materijala na internetu mora biti praćena hiper linkom do web stranice teletrade.org. Automatski uvoz materijala i informacija sa stranice je zabranjen.
Ako imate bilo kakvih pitanja, obratite nam se pr@teletrade.global.
транcфери