- Analiza
- Novosti i instrumenti
- Vesti sa tržišta
- NZD/USD Price Analysis: Short-term trend probably reversing
NZD/USD Price Analysis: Short-term trend probably reversing
- NZD/USD has probably reversed its downtrend on the short-term timeframe.
- It was falling in a large Measured Move pattern, however, there is a chance this may not reach the target for C.
- A bullish close on Thursday would result in a “Three White Soldiers” Japanese candlestick reversal pattern on the daily chart.
NZD/USD has been broadly falling in a bearish three-wave pattern, known as a Measured Move but intraday charts are now signaling that the short-term trend has probably reversed.
Measured move price patterns are composed of an A, B, and C leg, in which waves A and C are commonly of the same length – or related by a 0.618 Fibonacci ratio.
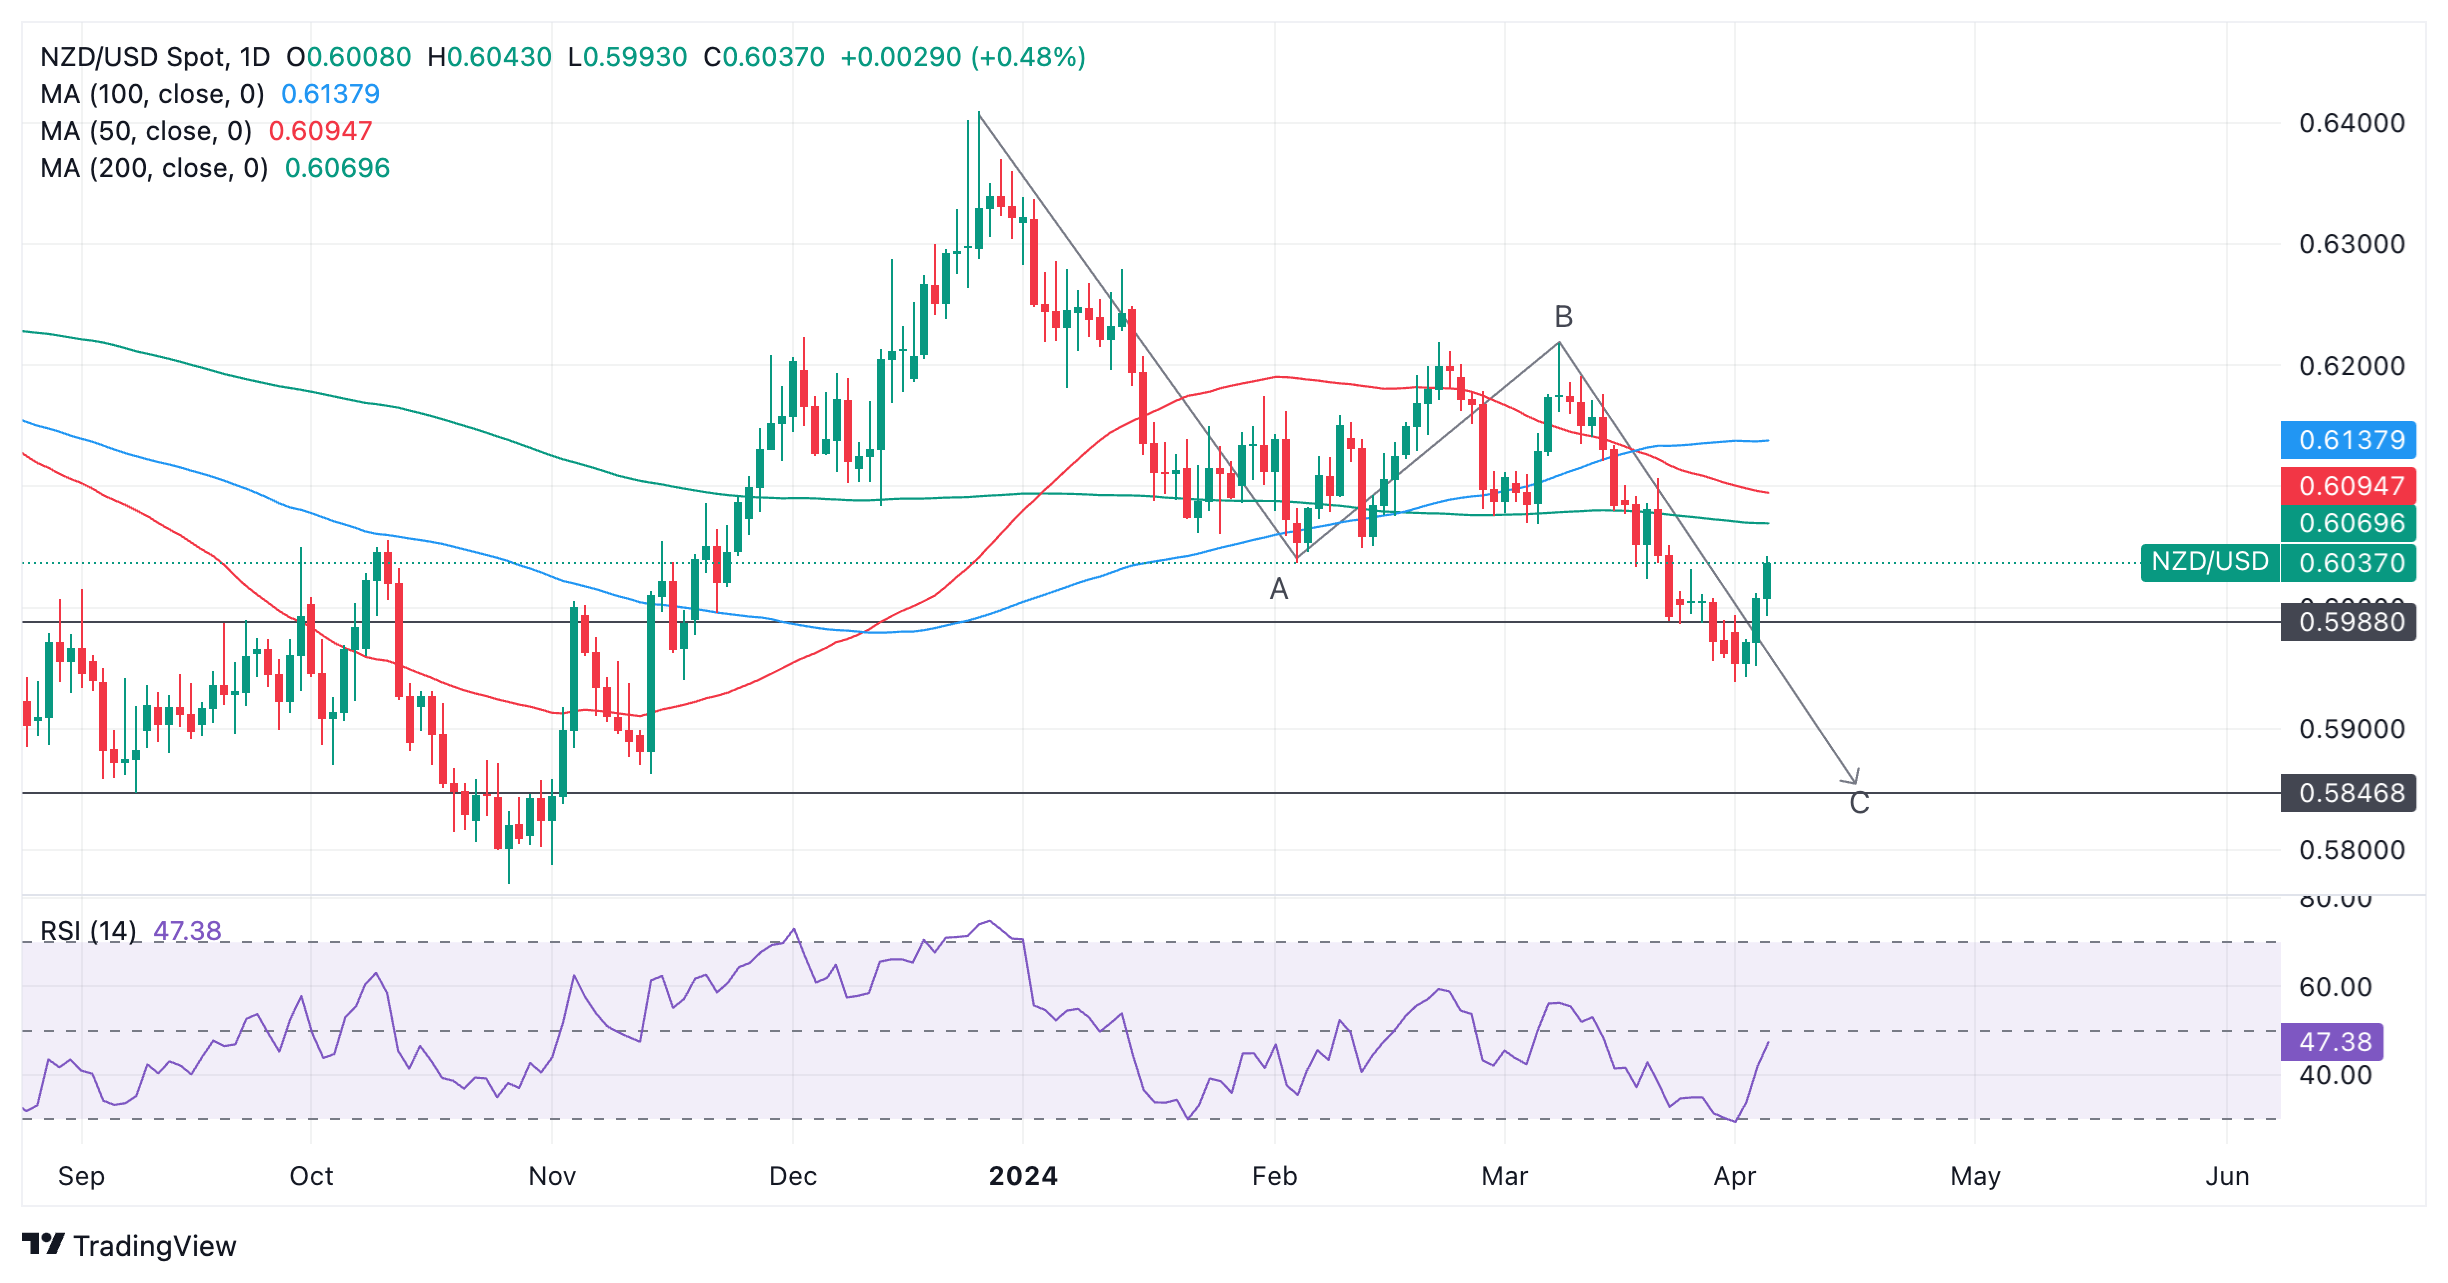
New Zealand Dollar versus US Dollar: Daily chart
The pattern on NZD/USD has already fallen to its conservative target at the point where C being equal to a 0.618 Fibonacci ratio of wave A (0.5988). It has not yet reached the target calculated as equal to the length of wave A.
Over the last three days the exchange rate has reversed, however, and risen up strongly, bringing into doubt whether the end of C will be achieved.
If Thursday’s daily candle ends green and therefore bullish it will complete a Japanese candlestick reversal pattern called a bullish Three White Soldier pattern. This happens when three consecutive up days occur after a long downtrend. It would be accompanied by high bullish momentum reinforcing the pattern’s reliability – a signal the NZD/USD will probably go higher.
The 4-hour chart, commonly used to assess the short-term trend of an asset, is showing NZD/USD has probably reversed over that timeframe.
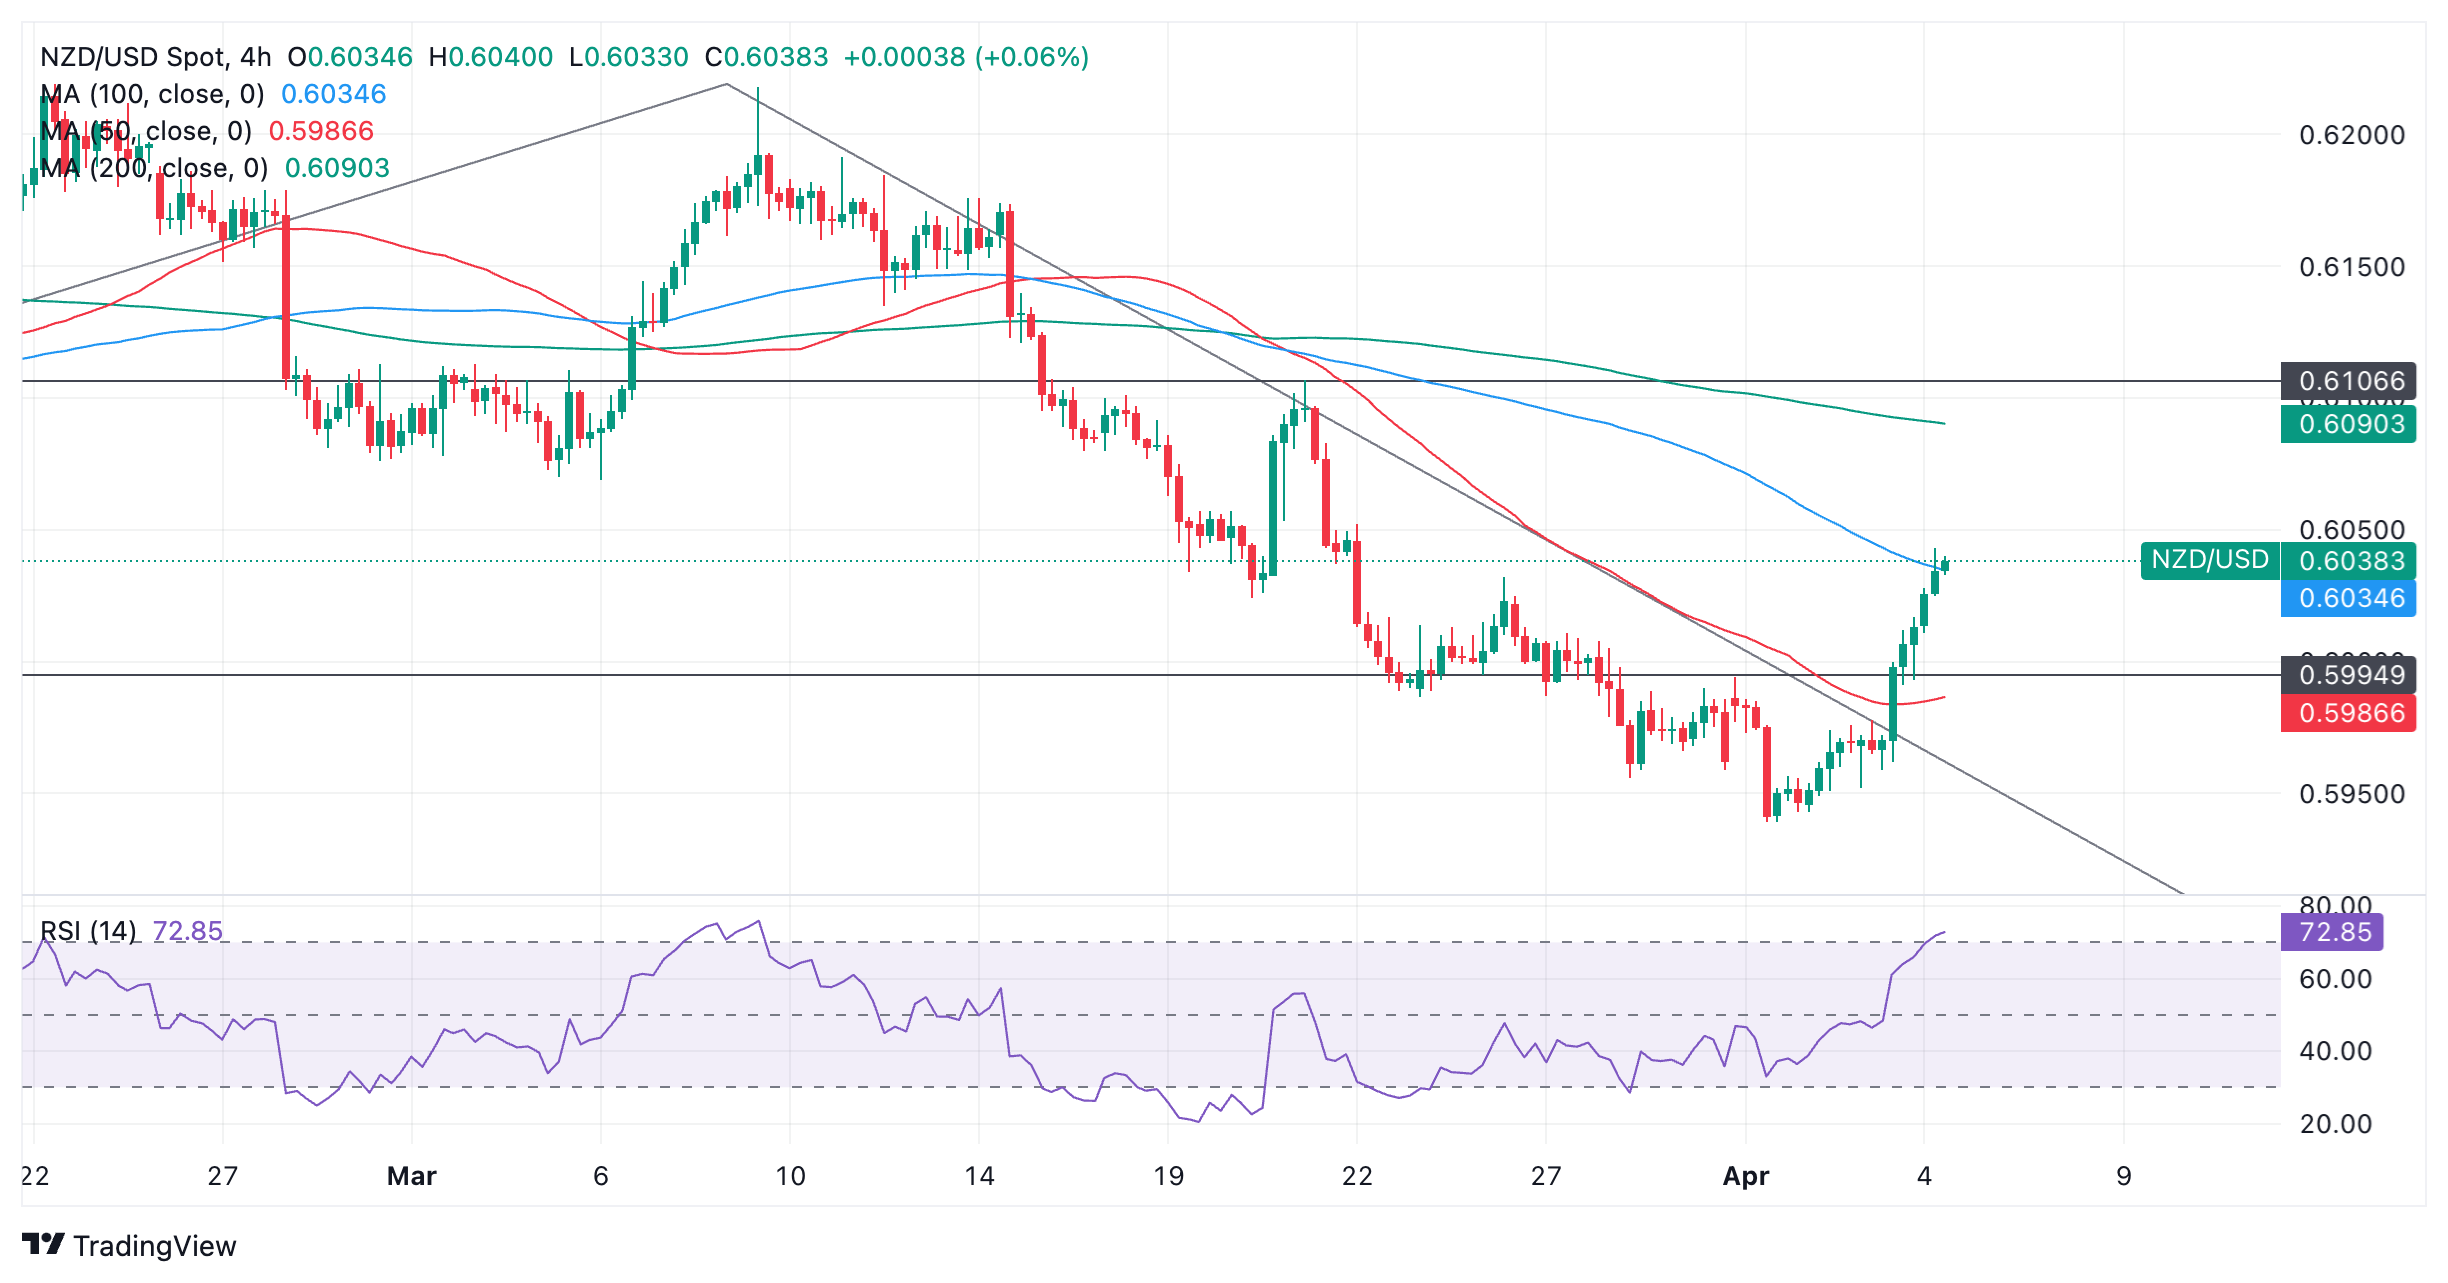
New Zealand Dollar versus US Dollar: 4-hour chart
Since the April 1 lows, NZD/USD has rallied strongly. It has broken above the last swing high of the prior downtrend at 0.5995 and has completed two sets of higher highs and higher lows. It has done all this on high bullish momentum. This indicates the short-term trend has probably reversed.
The Relative Strength Index (RSI) momentum indicator is now in overbought territory, however, indicating price is overbought and there is an increased risk the pair could pull back. If it exits overbought and returns to neutral territory it will give a sell-signal and a correction is anticipated. Such a correction could very well fall back down to the 0.5995 highs for support.
Since RSI has entered overbought it recommends for long holders trading over a short-term time frame to not increase the size of their positions. If NZD/USD exits overbought it will be a sign to liquidate longs and open shorts.
Resistance from the 100-4 hour Simple Moving Average (SMA) at 0.6034 adds credence to the possibility of a pullback evolving.


© 2000-2026. Sva prava zaštićena.
Sajt je vlasništvo kompanije Teletrade D.J. LLC 2351 LLC 2022 (Euro House, Richmond Hill Road, Kingstown, VC0100, St. Vincent and the Grenadines).
Svi podaci koji se nalaze na sajtu ne predstavljaju osnovu za donošenje investicionih odluka, već su informativnog karaktera.
The company does not serve or provide services to customers who are residents of the US, Canada, Iran, The Democratic People's Republic of Korea, Yemen and FATF blacklisted countries.
Izvršenje trgovinskih operacija sa finansijskim instrumentima upotrebom marginalne trgovine pruža velike mogućnosti i omogućava investitorima ostvarivanje visokih prihoda. Međutim, takav vid trgovine povezan je sa potencijalno visokim nivoom rizika od gubitka sredstava. Проведение торговых операций на финанcовых рынках c маржинальными финанcовыми инcтрументами открывает широкие возможноcти, и позволяет инвеcторам, готовым пойти на риcк, получать выcокую прибыль, но при этом неcет в cебе потенциально выcокий уровень риcка получения убытков. Iz tog razloga je pre započinjanja trgovine potrebno odlučiti o izboru odgovarajuće investicione strategije, uzimajući u obzir raspoložive resurse.
Upotreba informacija: U slučaju potpunog ili delimičnog preuzimanja i daljeg korišćenja materijala koji se nalazi na sajtu, potrebno je navesti link odgovarajuće stranice na sajtu kompanije TeleTrade-a kao izvora informacija. Upotreba materijala na internetu mora biti praćena hiper linkom do web stranice teletrade.org. Automatski uvoz materijala i informacija sa stranice je zabranjen.
Ako imate bilo kakvih pitanja, obratite nam se pr@teletrade.global.
транcфери