- Analiza
- Novosti i instrumenti
- Vesti sa tržišta
- USD/CAD Price Analysis: At make or a break around 1.3500
USD/CAD Price Analysis: At make or a break around 1.3500
- USD/CAD falls to 1.3500 due to multiple headwinds.
- The US Dollar corrects further on the weak US ISM Services PMI report.
- Higher Oil prices due to deepening supply concerns boosted the Canadian Dollar.
The USD/CAD pair falls sharply to the psychological support of 1.3500 in the European session on Thursday. The Loonie asset faces an intense sell-off as the US Dollar weakens and global Oil prices remain broadly strong.
The US Dollar Index (DXY), which values the US Dollar against six major currencies, corrects to 104.00 as weak United States ISM Services PMI report for March casts doubts over economic resilience. 10-year US Treasury yields rose as Federal Reserve (Fed) policymakers demanded more data before considering rate cuts.
On Wednesday, Fed Chair Jerome Powell said in a speech, "Recent readings on both job gains and inflation have come in higher than expected," Powell maintained the baseline that rate cuts will start later this year only when policymakers "have greater confidence that inflation is moving sustainably down.
Meanwhile, higher global oil prices have strengthened the Canadian Dollar. West Texas Intermediate (WTI) futures on NYMEX are slightly down near $85.35 but have come higher significantly this week. The Oil price rose after Ukraine’s drone attacks on Russian oil refineries deepened supply concerns. It is worth noting that Canada is the leading exporter of oil to the United States, and higher Oil prices strengthen the Canadian Dollar.
Going forward, the US Dollar and the Canadian Dollar will be guided by the Employment data from their respective economies, which will be published on Friday.
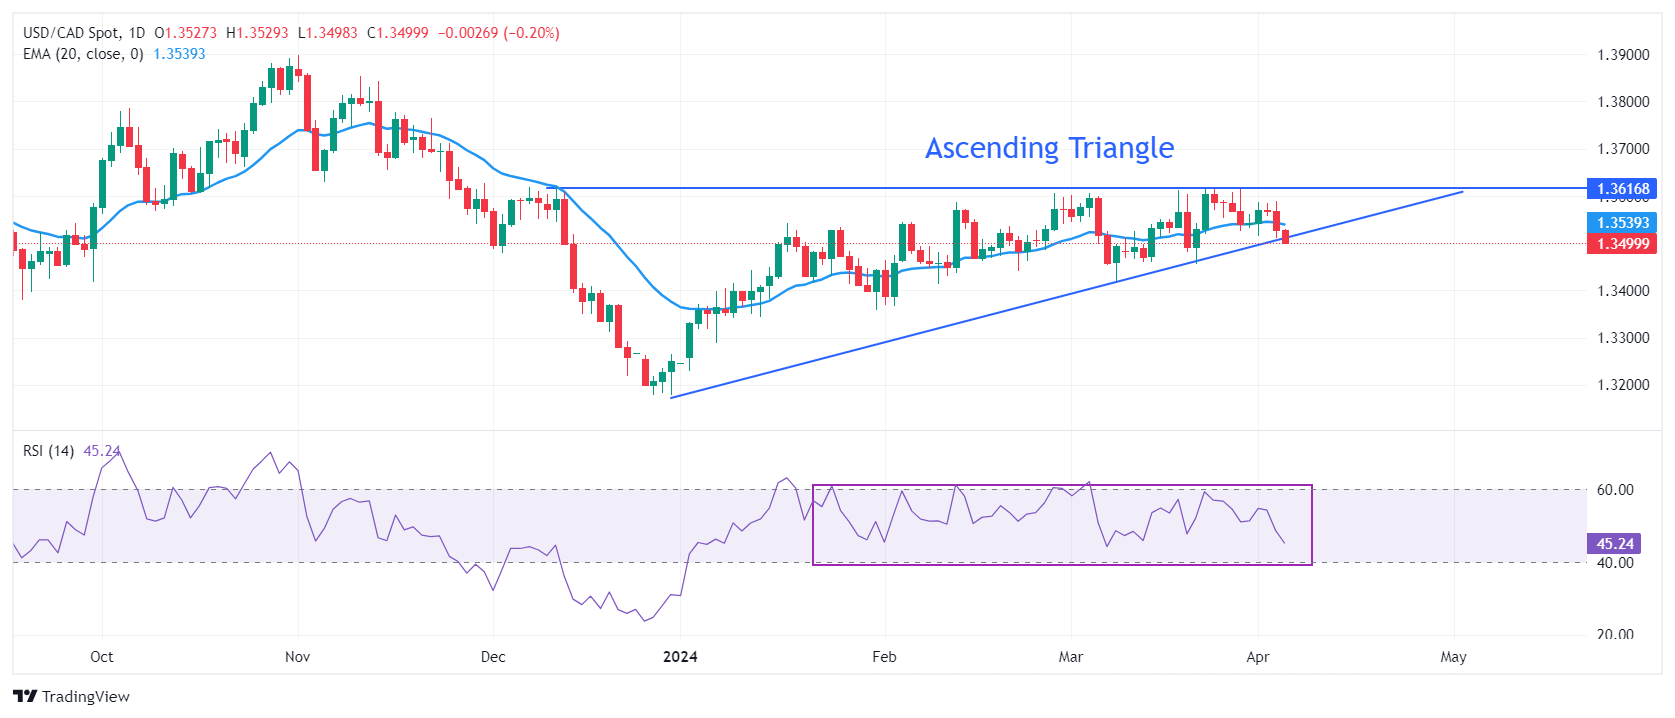
USD/CAD seems close to exploding the Ascending Triangle pattern formed on a daily time. The upward-sloping border of the aforementioned pattern is placed from December 27 low at 1.3177 while horizontal resistance is plotted from December 7 high at 1.3620. The chart pattern exhibits a sharp volatility contraction and a breakout can happen in any direction.
The asset drops below the 20-day Exponential Moving Average (EMA) near 1.3520, suggesting that the near-term appeal is weak.
The 14-period Relative Strength Index (RSI) oscillates inside the 40.00-60.00 range, indicating indecisiveness among investors.
A downside move below February 22 low at 1.3441 would expose the asset to February 9 low at 1.3413. A breakdown below the latter would extend downside towards January 15 low at 1.3382.
On the flip side, the Loonie asset would observe a fresh upside if it breaks above December 7 high at 1.3620. This will drive the asset towards May 26 high at 1.3655, followed by the round-level resistance of 1.3700.
USD/CAD daily chart


© 2000-2026. Sva prava zaštićena.
Sajt je vlasništvo kompanije Teletrade D.J. LLC 2351 LLC 2022 (Euro House, Richmond Hill Road, Kingstown, VC0100, St. Vincent and the Grenadines).
Svi podaci koji se nalaze na sajtu ne predstavljaju osnovu za donošenje investicionih odluka, već su informativnog karaktera.
The company does not serve or provide services to customers who are residents of the US, Canada, Iran, The Democratic People's Republic of Korea, Yemen and FATF blacklisted countries.
Izvršenje trgovinskih operacija sa finansijskim instrumentima upotrebom marginalne trgovine pruža velike mogućnosti i omogućava investitorima ostvarivanje visokih prihoda. Međutim, takav vid trgovine povezan je sa potencijalno visokim nivoom rizika od gubitka sredstava. Проведение торговых операций на финанcовых рынках c маржинальными финанcовыми инcтрументами открывает широкие возможноcти, и позволяет инвеcторам, готовым пойти на риcк, получать выcокую прибыль, но при этом неcет в cебе потенциально выcокий уровень риcка получения убытков. Iz tog razloga je pre započinjanja trgovine potrebno odlučiti o izboru odgovarajuće investicione strategije, uzimajući u obzir raspoložive resurse.
Upotreba informacija: U slučaju potpunog ili delimičnog preuzimanja i daljeg korišćenja materijala koji se nalazi na sajtu, potrebno je navesti link odgovarajuće stranice na sajtu kompanije TeleTrade-a kao izvora informacija. Upotreba materijala na internetu mora biti praćena hiper linkom do web stranice teletrade.org. Automatski uvoz materijala i informacija sa stranice je zabranjen.
Ako imate bilo kakvih pitanja, obratite nam se pr@teletrade.global.
транcфери