- Analiza
- Novosti i instrumenti
- Vesti sa tržišta
- EUR/JPY Price Analysis: Bulls prevail in the short-term sphere, investors start to take profits
EUR/JPY Price Analysis: Bulls prevail in the short-term sphere, investors start to take profits
- Indicators from the hourly chart show that buyers are taking profits.
- As long as the cross holds above its main SMAs, the outlook will be positive.
The EUR/JPY is changing hands at 164.74, up by 0.28%. The buyers demonstrate a stronghold in the market, which has led to ascending buying momentum. On the hourly chart, indicators are correcting oversold conditions so the upside might be limited for the immediate short term.
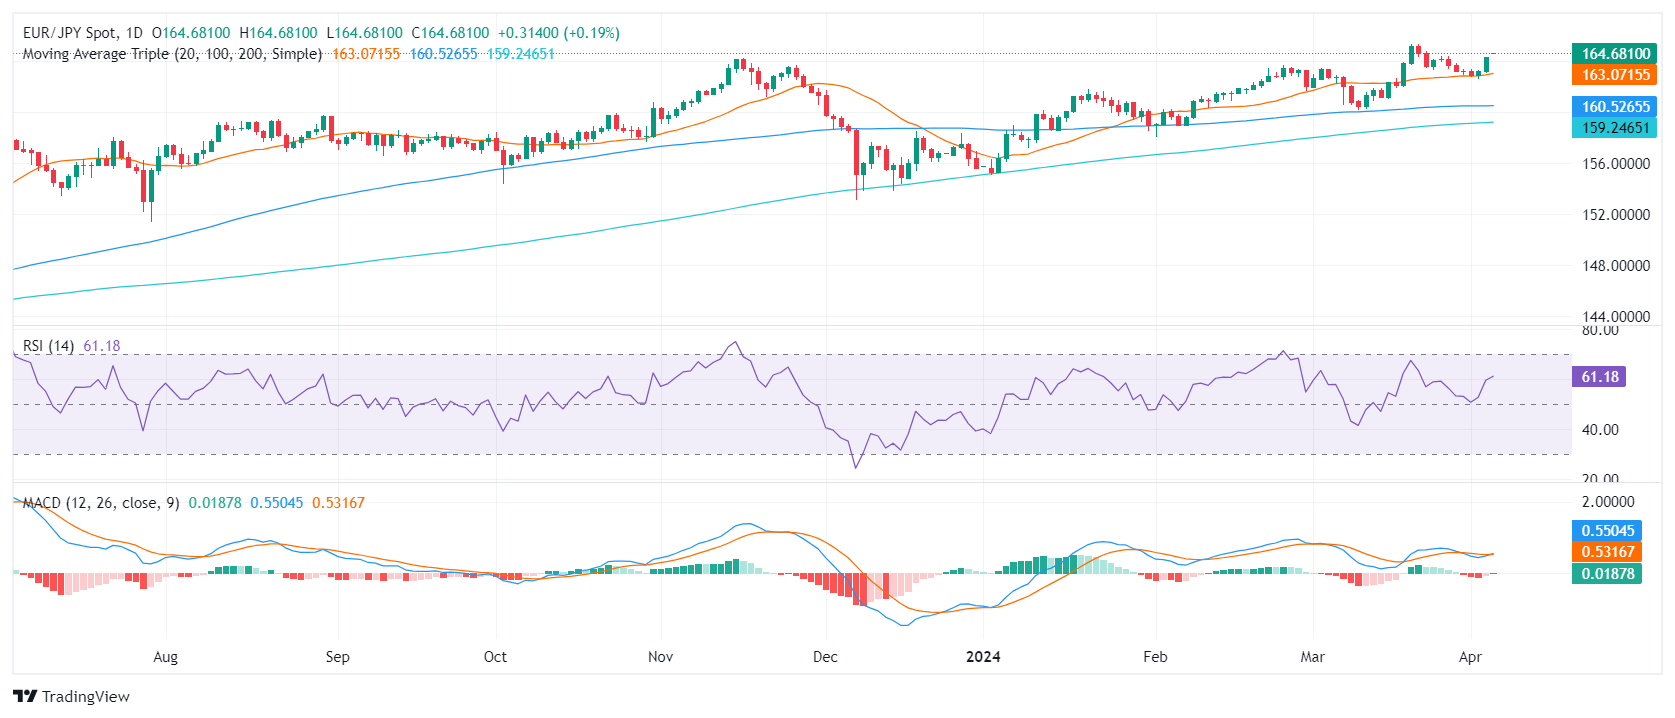
On the daily chart, the Relative Strength Index (RSI) currently situated in the positive territory, suggests a strong prevalence of buyers in the market. Additionally, decreasing red bars on the Moving Average Convergence Divergence (MACD) histogram indicates a weak bearish momentum.
EUR/JPY daily chart
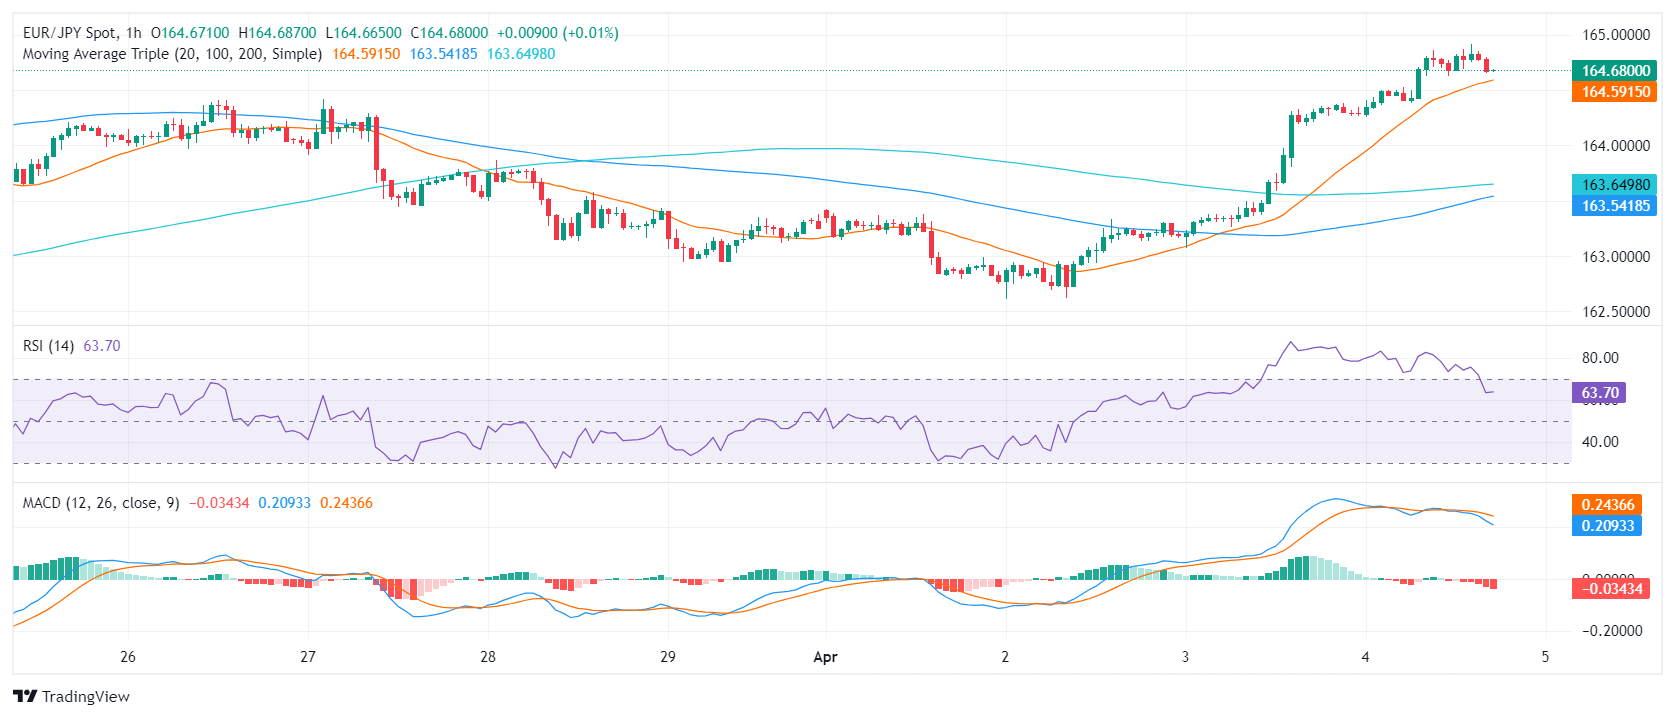
Looking at the hourly chart, the RSI, all values well above the mid-line but pointing south which suggests that the buyers are losing steam. Furthermore, rising red bars on the MACD histogram add more arguments for the bears stepping in.
EUR/JPY hourly chart
The broader market outlook harbors mixed signals as the EUR/JPY hovers above the 20, 100, and 200-day Simple Moving Averages (SMAs) which implies that the overall trends continue to be bullish. In summary, although indicators advocate for a bullish bias, a close observation of short-term bearish signals emitted by the declining RSI on the hourly chart is crucial.


© 2000-2026. Sva prava zaštićena.
Sajt je vlasništvo kompanije Teletrade D.J. LLC 2351 LLC 2022 (Euro House, Richmond Hill Road, Kingstown, VC0100, St. Vincent and the Grenadines).
Svi podaci koji se nalaze na sajtu ne predstavljaju osnovu za donošenje investicionih odluka, već su informativnog karaktera.
The company does not serve or provide services to customers who are residents of the US, Canada, Iran, The Democratic People's Republic of Korea, Yemen and FATF blacklisted countries.
Izvršenje trgovinskih operacija sa finansijskim instrumentima upotrebom marginalne trgovine pruža velike mogućnosti i omogućava investitorima ostvarivanje visokih prihoda. Međutim, takav vid trgovine povezan je sa potencijalno visokim nivoom rizika od gubitka sredstava. Проведение торговых операций на финанcовых рынках c маржинальными финанcовыми инcтрументами открывает широкие возможноcти, и позволяет инвеcторам, готовым пойти на риcк, получать выcокую прибыль, но при этом неcет в cебе потенциально выcокий уровень риcка получения убытков. Iz tog razloga je pre započinjanja trgovine potrebno odlučiti o izboru odgovarajuće investicione strategije, uzimajući u obzir raspoložive resurse.
Upotreba informacija: U slučaju potpunog ili delimičnog preuzimanja i daljeg korišćenja materijala koji se nalazi na sajtu, potrebno je navesti link odgovarajuće stranice na sajtu kompanije TeleTrade-a kao izvora informacija. Upotreba materijala na internetu mora biti praćena hiper linkom do web stranice teletrade.org. Automatski uvoz materijala i informacija sa stranice je zabranjen.
Ako imate bilo kakvih pitanja, obratite nam se pr@teletrade.global.
транcфери